Kubernetes operators for databases have become a real alternative to cloud DBaaS (Database-as-a-Service) offerings. Operators handle most “Day 2” database operations such as high availability, backups, and disaster recovery. Moreover, running databases in Kubernetes is cost-effective and eliminates vendor lock-in.
Despite the high level of automation, no operator can guarantee 100% availability or a flawless performance of your database, so it is very important to get visibility into each database cluster. Coroot can help you with that. For Postgres clusters managed by the Postgres Operator, it not only highlights performance issues of a particular instance but also detects cluster-level issues. Thanks to the eBPF-based connection metrics, Coroot can track all communications between cluster components such as Patroni, Postgres, Pgbouncer, and the Kubernetes API server.
To test Coroot, we reproduce real failure scenarios in our lab and record their telemetry. This allows us to play back any scenario second by second. In this post, I’ll use such recordings to show you how the Postgres operator and its underlying components handle various failures.
The lab
- A Kubernetes cluster: 1 master and 3 worker nodes
- Postgres operator v1.8.2
- Chaos Mesh for failure injection
- A test application (app) that runs queries on both the primary Postgres instance and its replicas.
- Observability: Prometheus, kube-state-metrics, coroot-node-agent, coroot-pg-agent
- A Postgres cluster of 3 instances:
apiVersion: "acid.zalan.do/v1"
kind: postgresql
metadata:
  name: db-main
  namespace: default
spec:
  teamId: db
  volume:
    size: 10Gi
  numberOfInstances: 3
  users:
    coroot: [superuser] # TODO: grant pg_monitor to coroot;
    app: []
  databases:
    app: app
  postgresql:
    version: "14"
  sidecars:
  - name: coroot-pg-agent
    image: ghcr.io/coroot/coroot-pg-agent:1.1.0
    env:
    - name: LISTEN
      value: ":9091"
    - name: PG_SCRAPE_INTERVAL
      value: "1s"
    - name: PGPASSWORD
      valueFrom: {secretKeyRef: {name: coroot.db-main.credentials.postgresql.acid.zalan.do, key: password}}
    - name: DSN
      value: "host=127.0.0.1 port=5432 user=coroot password=$(PGPASSWORD) dbname=postgres connect_timeout=1 statement_timeout=10000"
  podAnnotations:
    prometheus.io/scrape: 'true'
    prometheus.io/port: '9091'
In terms of Kubernetes, the cluster is a StatefulSet of 3 pods. Postgres within each pod is managed by Patroni. Patroni turns a bunch of Postgres instances into an HA (High Availability) cluster, it’s responsible for replication management and failovers/switchovers. When Patroni is deployed by the Postgres operator, it uses the Kubernetes control plane (kube-apiserver) as the DCS (Distributed Config Store) for leader election and storing the cluster state.
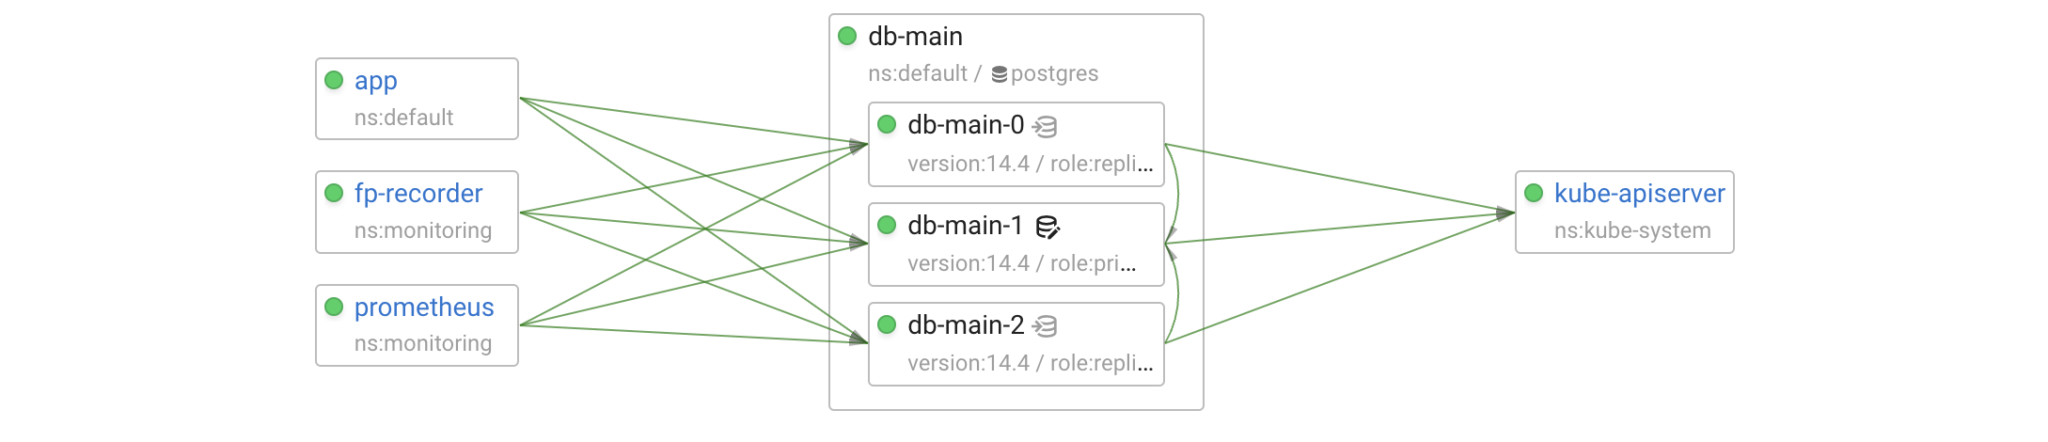
The operator creates two Kubernetes services for incoming client connections to each cluster: <cluster-name> pointing to the primary and <cluster-name>-repl pointing to the replicas.
$ kubectl get services -l cluster-name=db-main -l spilo-role
NAME             TYPE        CLUSTER-IP     EXTERNAL-IP   PORT(S)    AGE
db-main          ClusterIP   10.96.17.243   <none>        5432/TCP   6d18h
db-main-repl     ClusterIP   10.99.79.27    <none>        5432/TCP   6d18h
$ kubectl get endpoints -l cluster-name=db-main -l spilo-role
NAME           ENDPOINTS                           AGE
db-main        10.244.3.64:5432                    6d18h
db-main-repl   10.244.1.92:5432,10.244.2.82:5432   6d18h
A replica failure
Let’s start with the simplest failure scenario when a replica becomes unavailable. In such scenarios, I prefer to use network partitioning because this type of failure is harder to detect than Pod faults.

kind: NetworkChaos
apiVersion: chaos-mesh.org/v1alpha1
metadata:
  name: replica-net-partition
spec:
  selector:
    labelSelectors:
      application: spilo
      spilo-role: replica
  mode: one
  action: partition
  direction: both
The operator uses the hardcoded readiness probe configuration for the database pods. The probe makes a request to /readiness every 10 seconds and marks the pod as Unready after 3 unsuccessful attempts. Thus, we can expect that Kubernetes will stop forwarding connections to the failed pod within 30 seconds.
Let’s check it out!
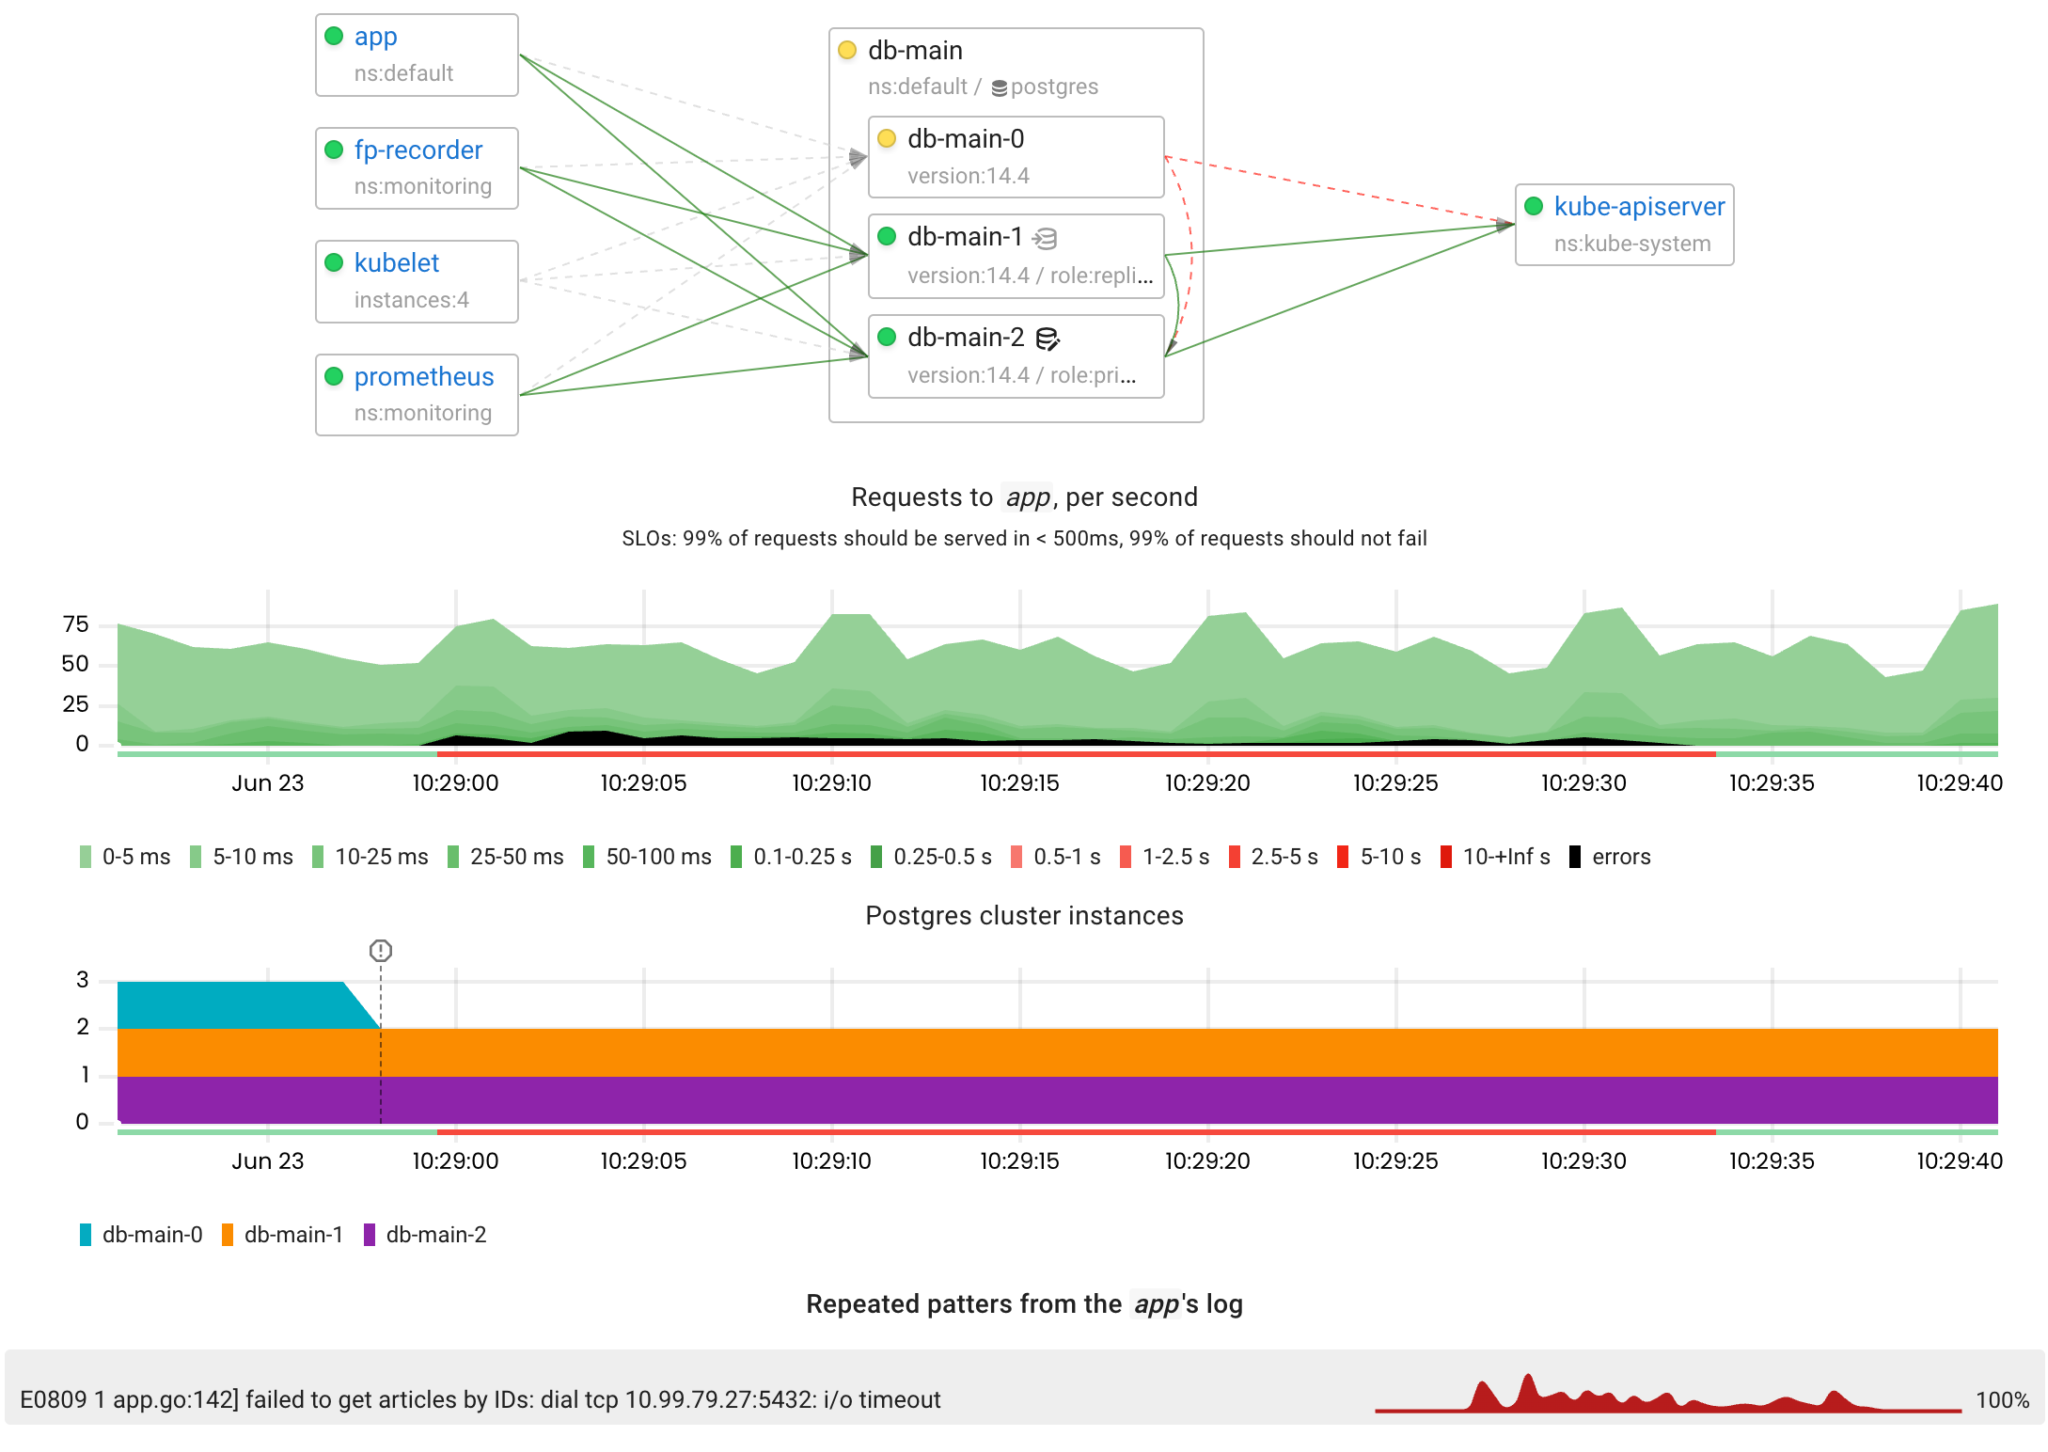
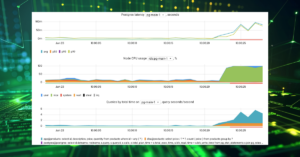
There were errors due to the inability to connect to the fenced replica, but these errors disappeared after 30 seconds when the replica was marked as Unready.
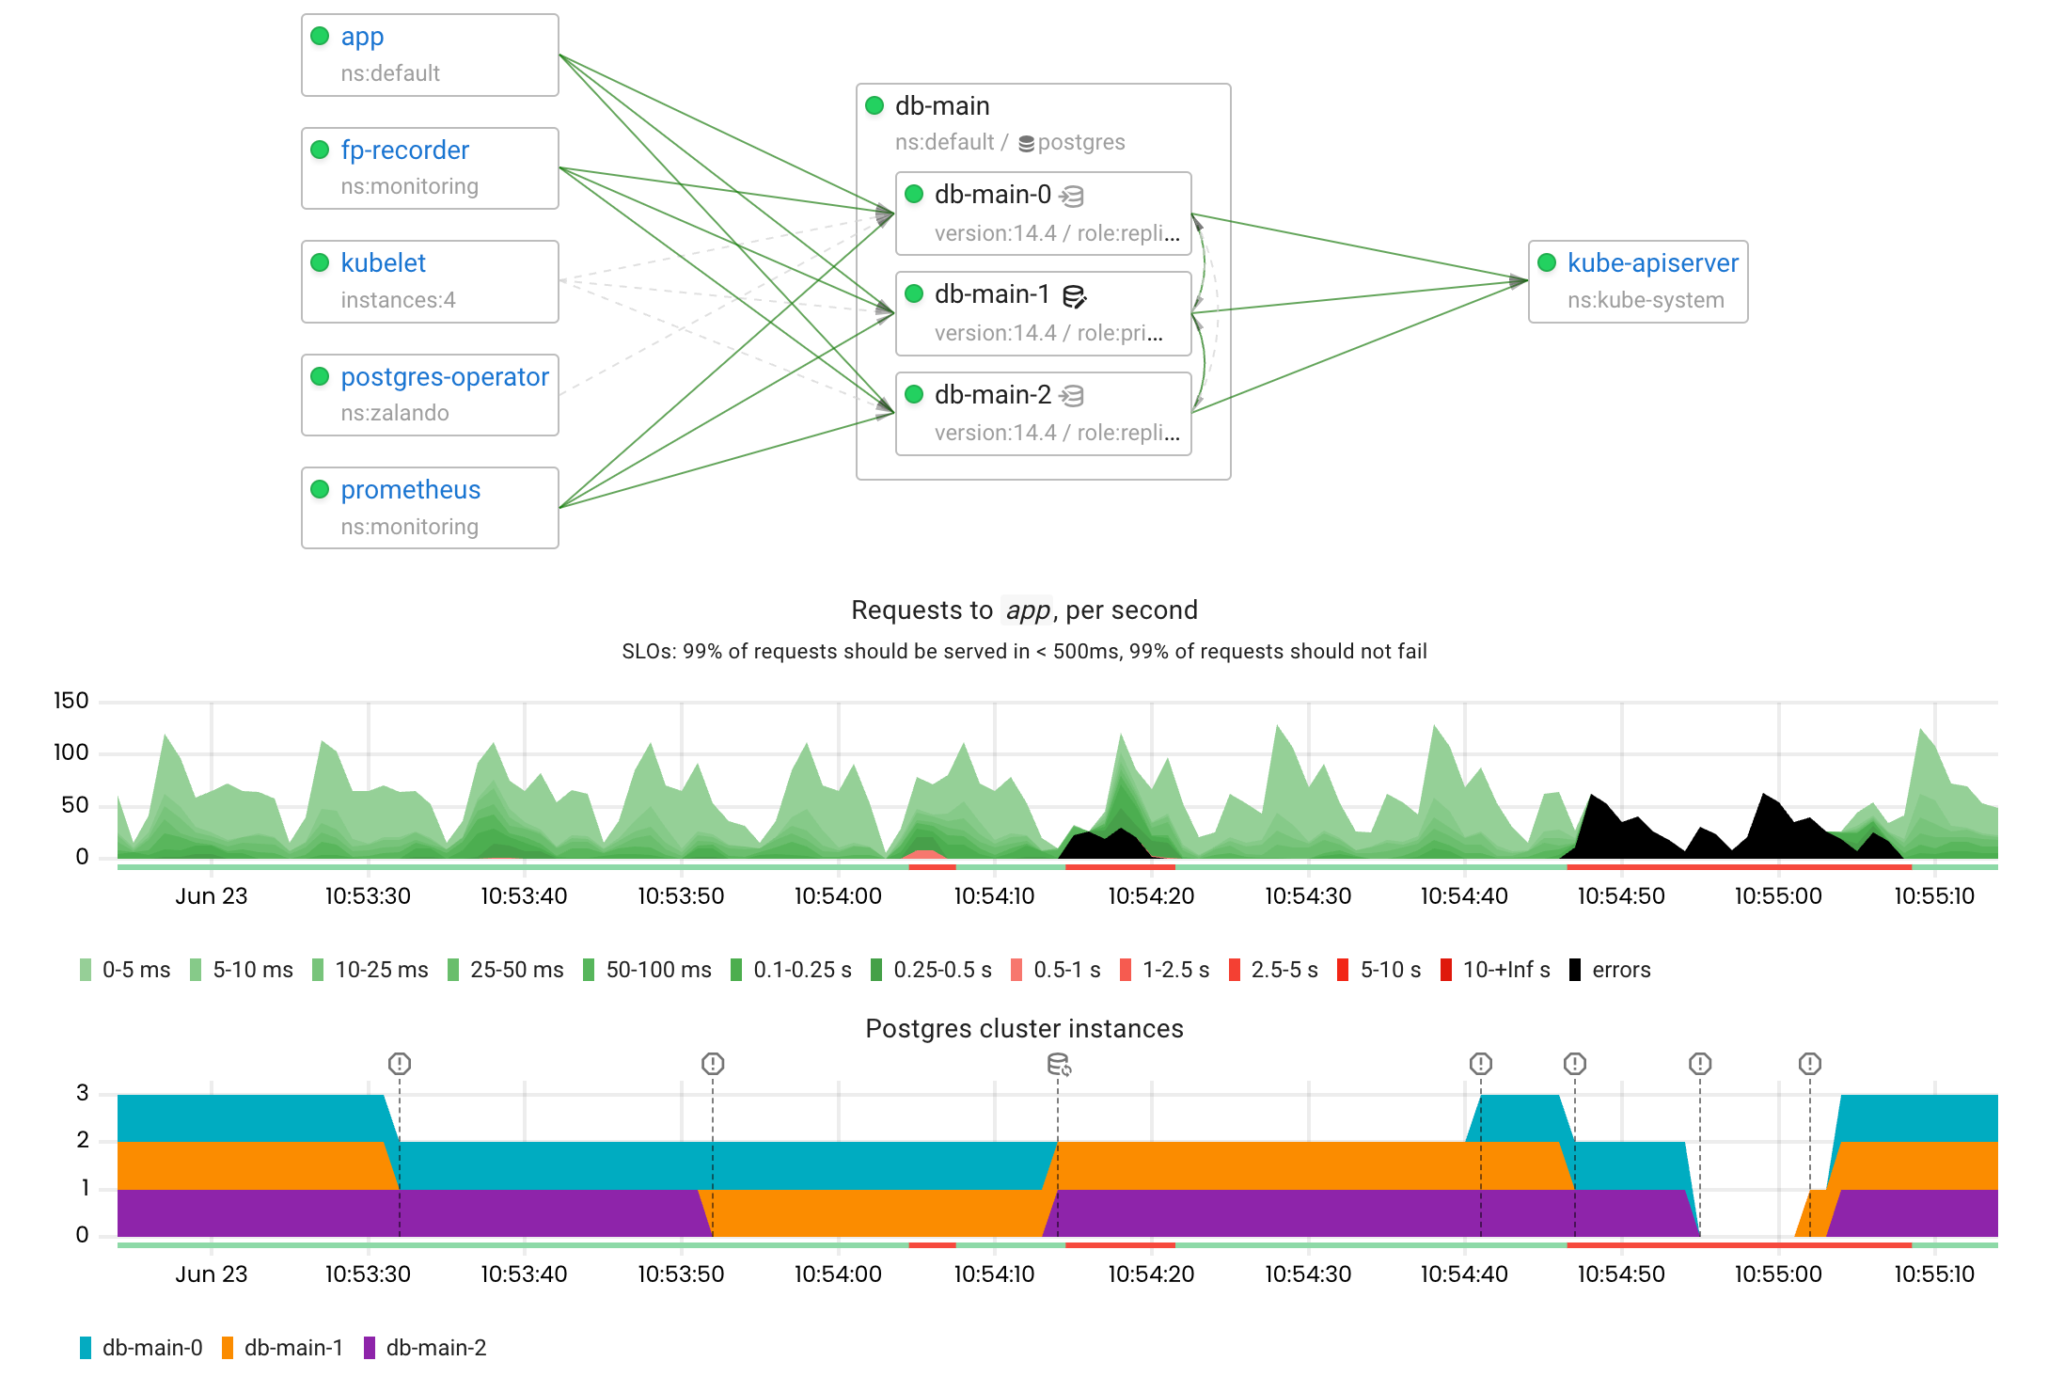
Failover
Now let’s see how the operator handles the failure of the primary Postgres instance using Patroni.

By default Patroni acquires the leader lock in the DCS (Distributed Configuration Store) with the TTL (Time-To-Live) at 30 seconds. In other words, the leader must refresh its lock every 30 seconds. If there is no network connectivity between the primary and the DCS (kube-apiserver in this case), the primary will not be able to refresh its lock. Therefore, the failover process should be started within this time interval.
The following NetworkChaos manifest isolates the primary Postgres pod from the rest of the network:
kind: NetworkChaos
apiVersion: chaos-mesh.org/v1alpha1
metadata:
  name: primary-net-partition
spec:
  selector:
    labelSelectors:
      application: spilo
      spilo-role: master
  mode: all
  action: partition
  direction: both
Let’s apply it and see the automatic failover mechanism in action!
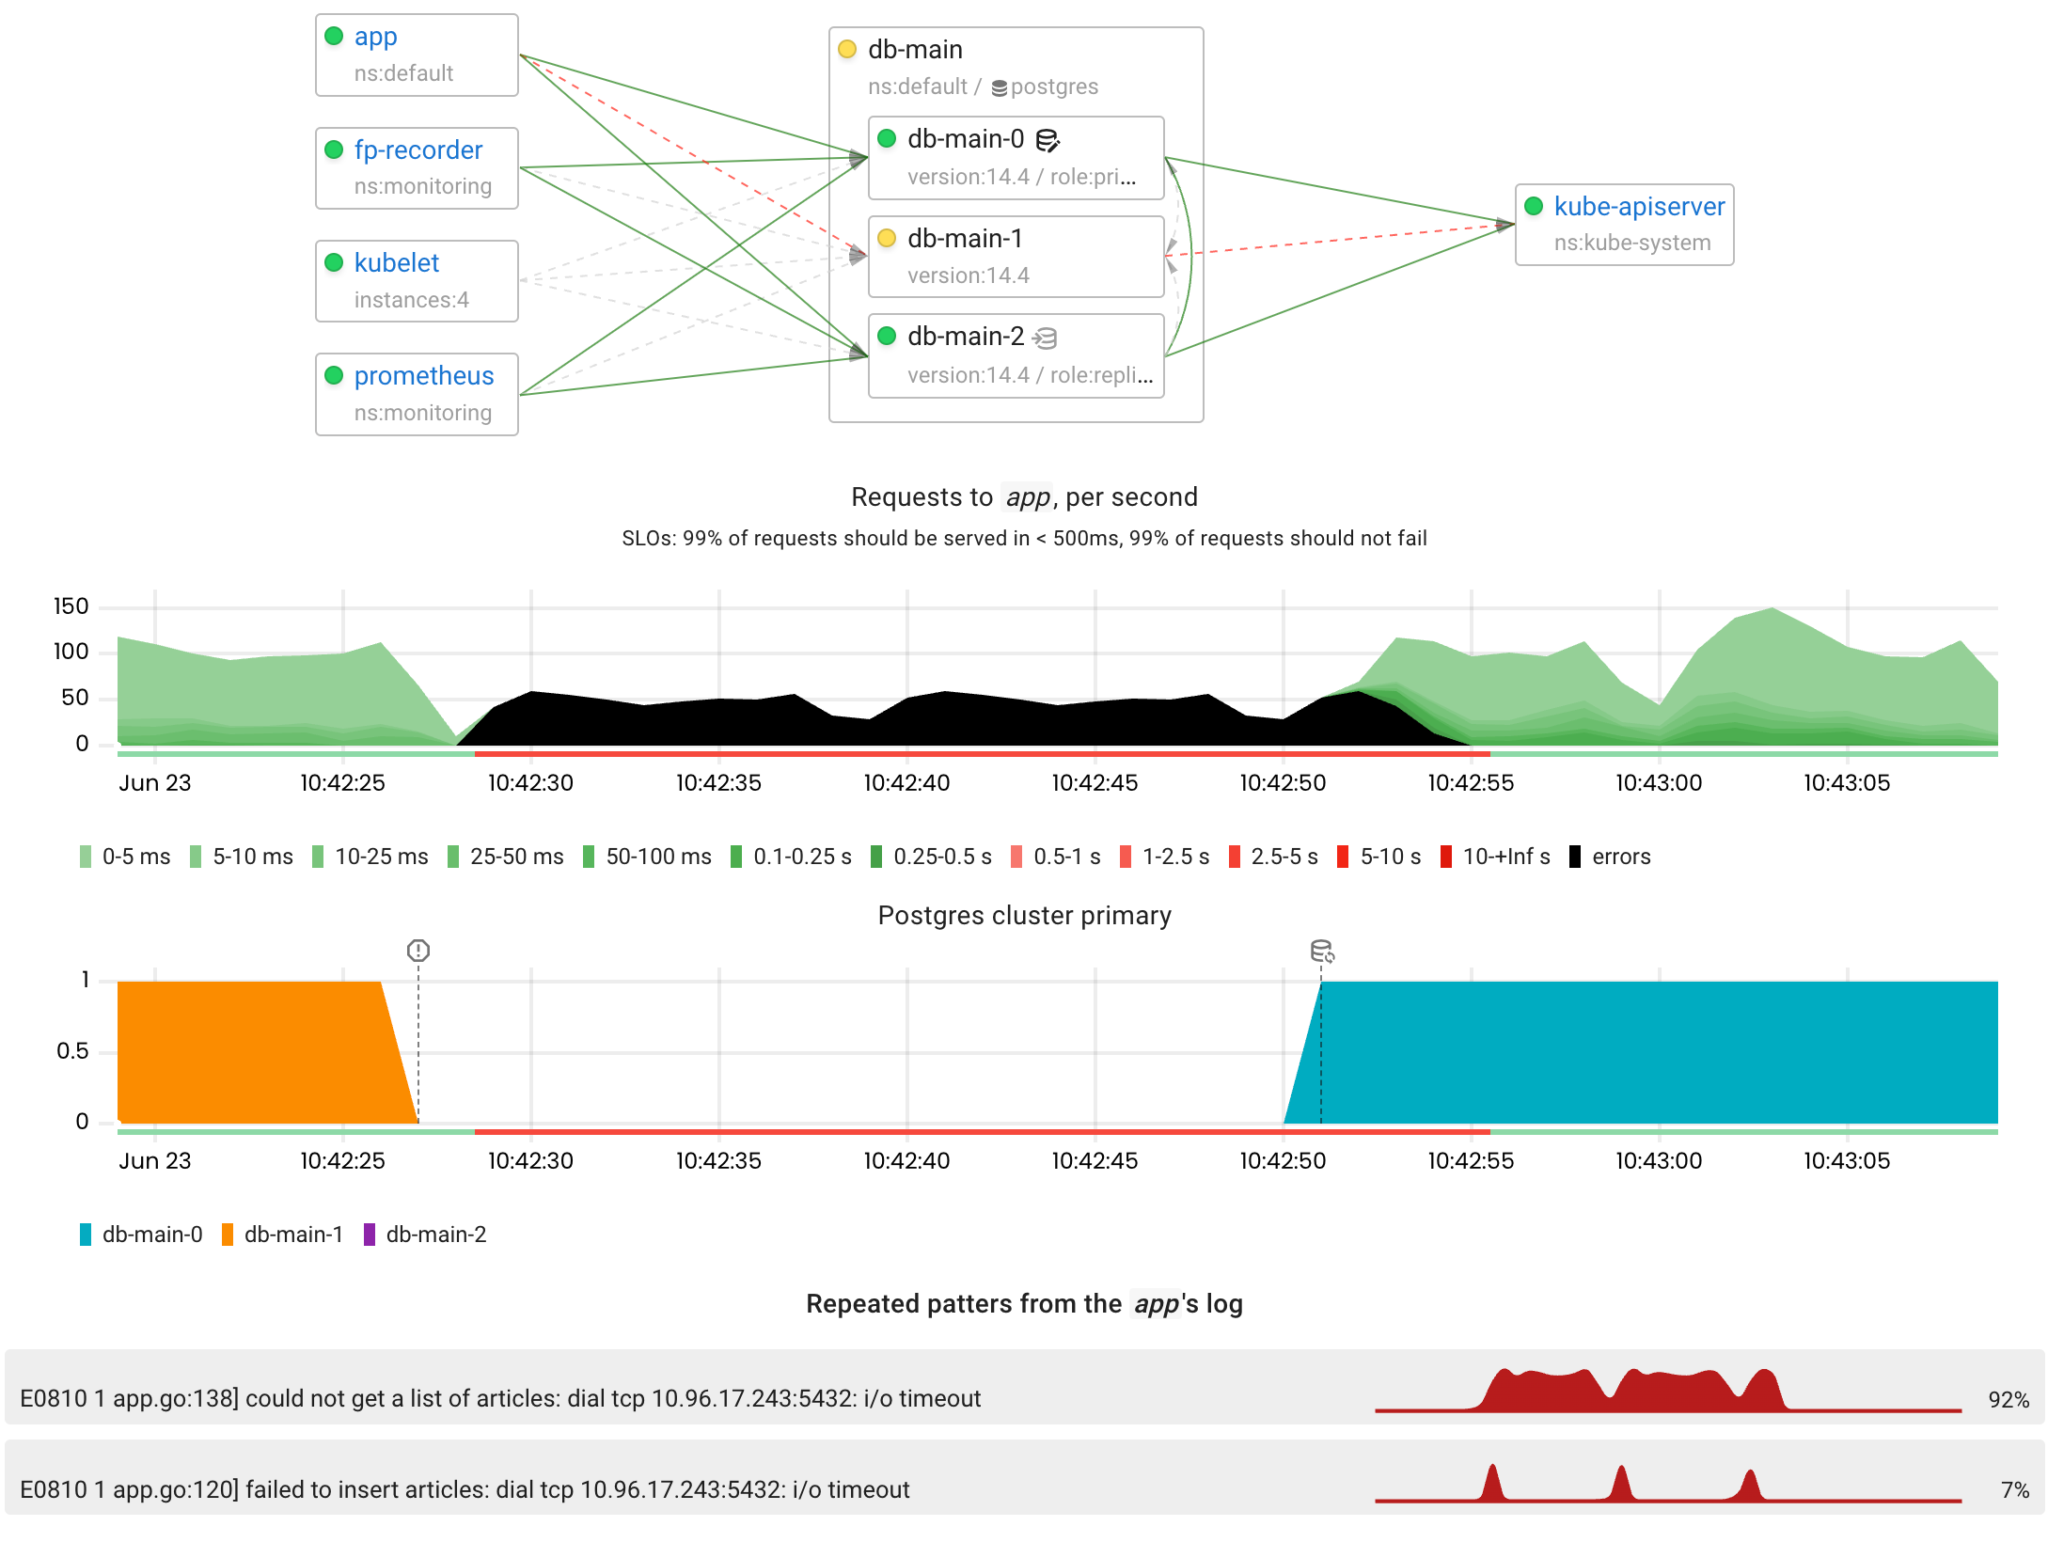
Wow, it works exactly as expected! The failover process was initiated 23 seconds after the primary Postgres had become unavailable . From the app’s perspective, the outage lasted only 27 seconds.
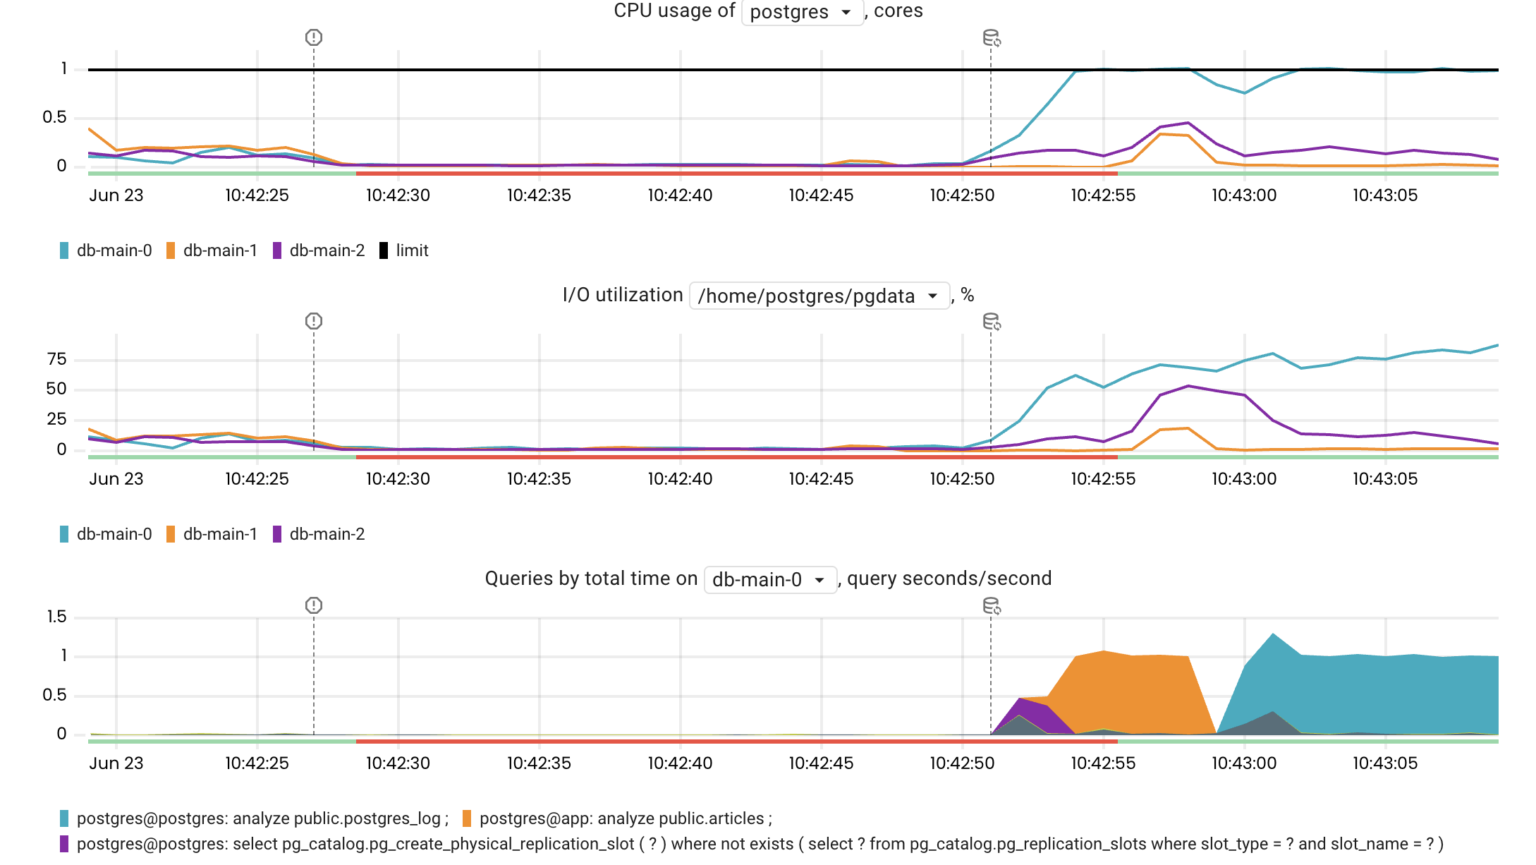
Another thing worth noting is that the new primary instance performed slowly for a while after being promoted because several processes were causing high disk and CPU utilization:
- CHECKPOINT initiated by Patroni on the primary after a switchover/failover
- ANALYZE updating table statistics
- warming up of the buffer and page caches
Replication lag
Read replicas are useful for scaling out read load. However, when using asynchronous replication, it takes some time for the new data to reach replicas. So, the application that executes queries on replicas must be tolerant to a little lag. On the other hand, if data stops replicating, it can affect the users of the application.

To illustrate such a scenario, we implemented a freshness check in our test application: if the delay in the data fetched from a replica and the primary exceeds 10 seconds, the app reports an error.
Our next step is making the replication lag grow. Roughly speaking, streaming replication in Postgres has 3 stages:
- Transferring WAL (Write-Ahead Logging) records to the replica through the network (this can be affected by a network attack)
- Writing WAL records to the disk on the replica (this can be affected by an I/O injection, but it might cause many side effects)
- Replaying WAL records on the replica (this can be affected by executing a long query on the replica, but this query will be terminated after max_standby_streaming_delay)
So, a network attack seems like the simplest way to cause high replication lag. Let’s simulate an 80% packet loss between the primary and a replica.
kind: NetworkChaos
apiVersion: chaos-mesh.org/v1alpha1
metadata:
  name: replica-to-primary-packet-loss
spec:
  selector:
    labelSelectors:
      spilo-role: replica
  mode: one
  action: loss
  loss:
    loss: '80'
  direction: both
  target:
    selector:
      labelSelectors:
        spilo-role: master
    mode: all
As you can see in the manifest above, Chaos Mesh can simulate a network fault between specific Kubernetes pods. It’s quite useful when we want to simulate partial network outages.
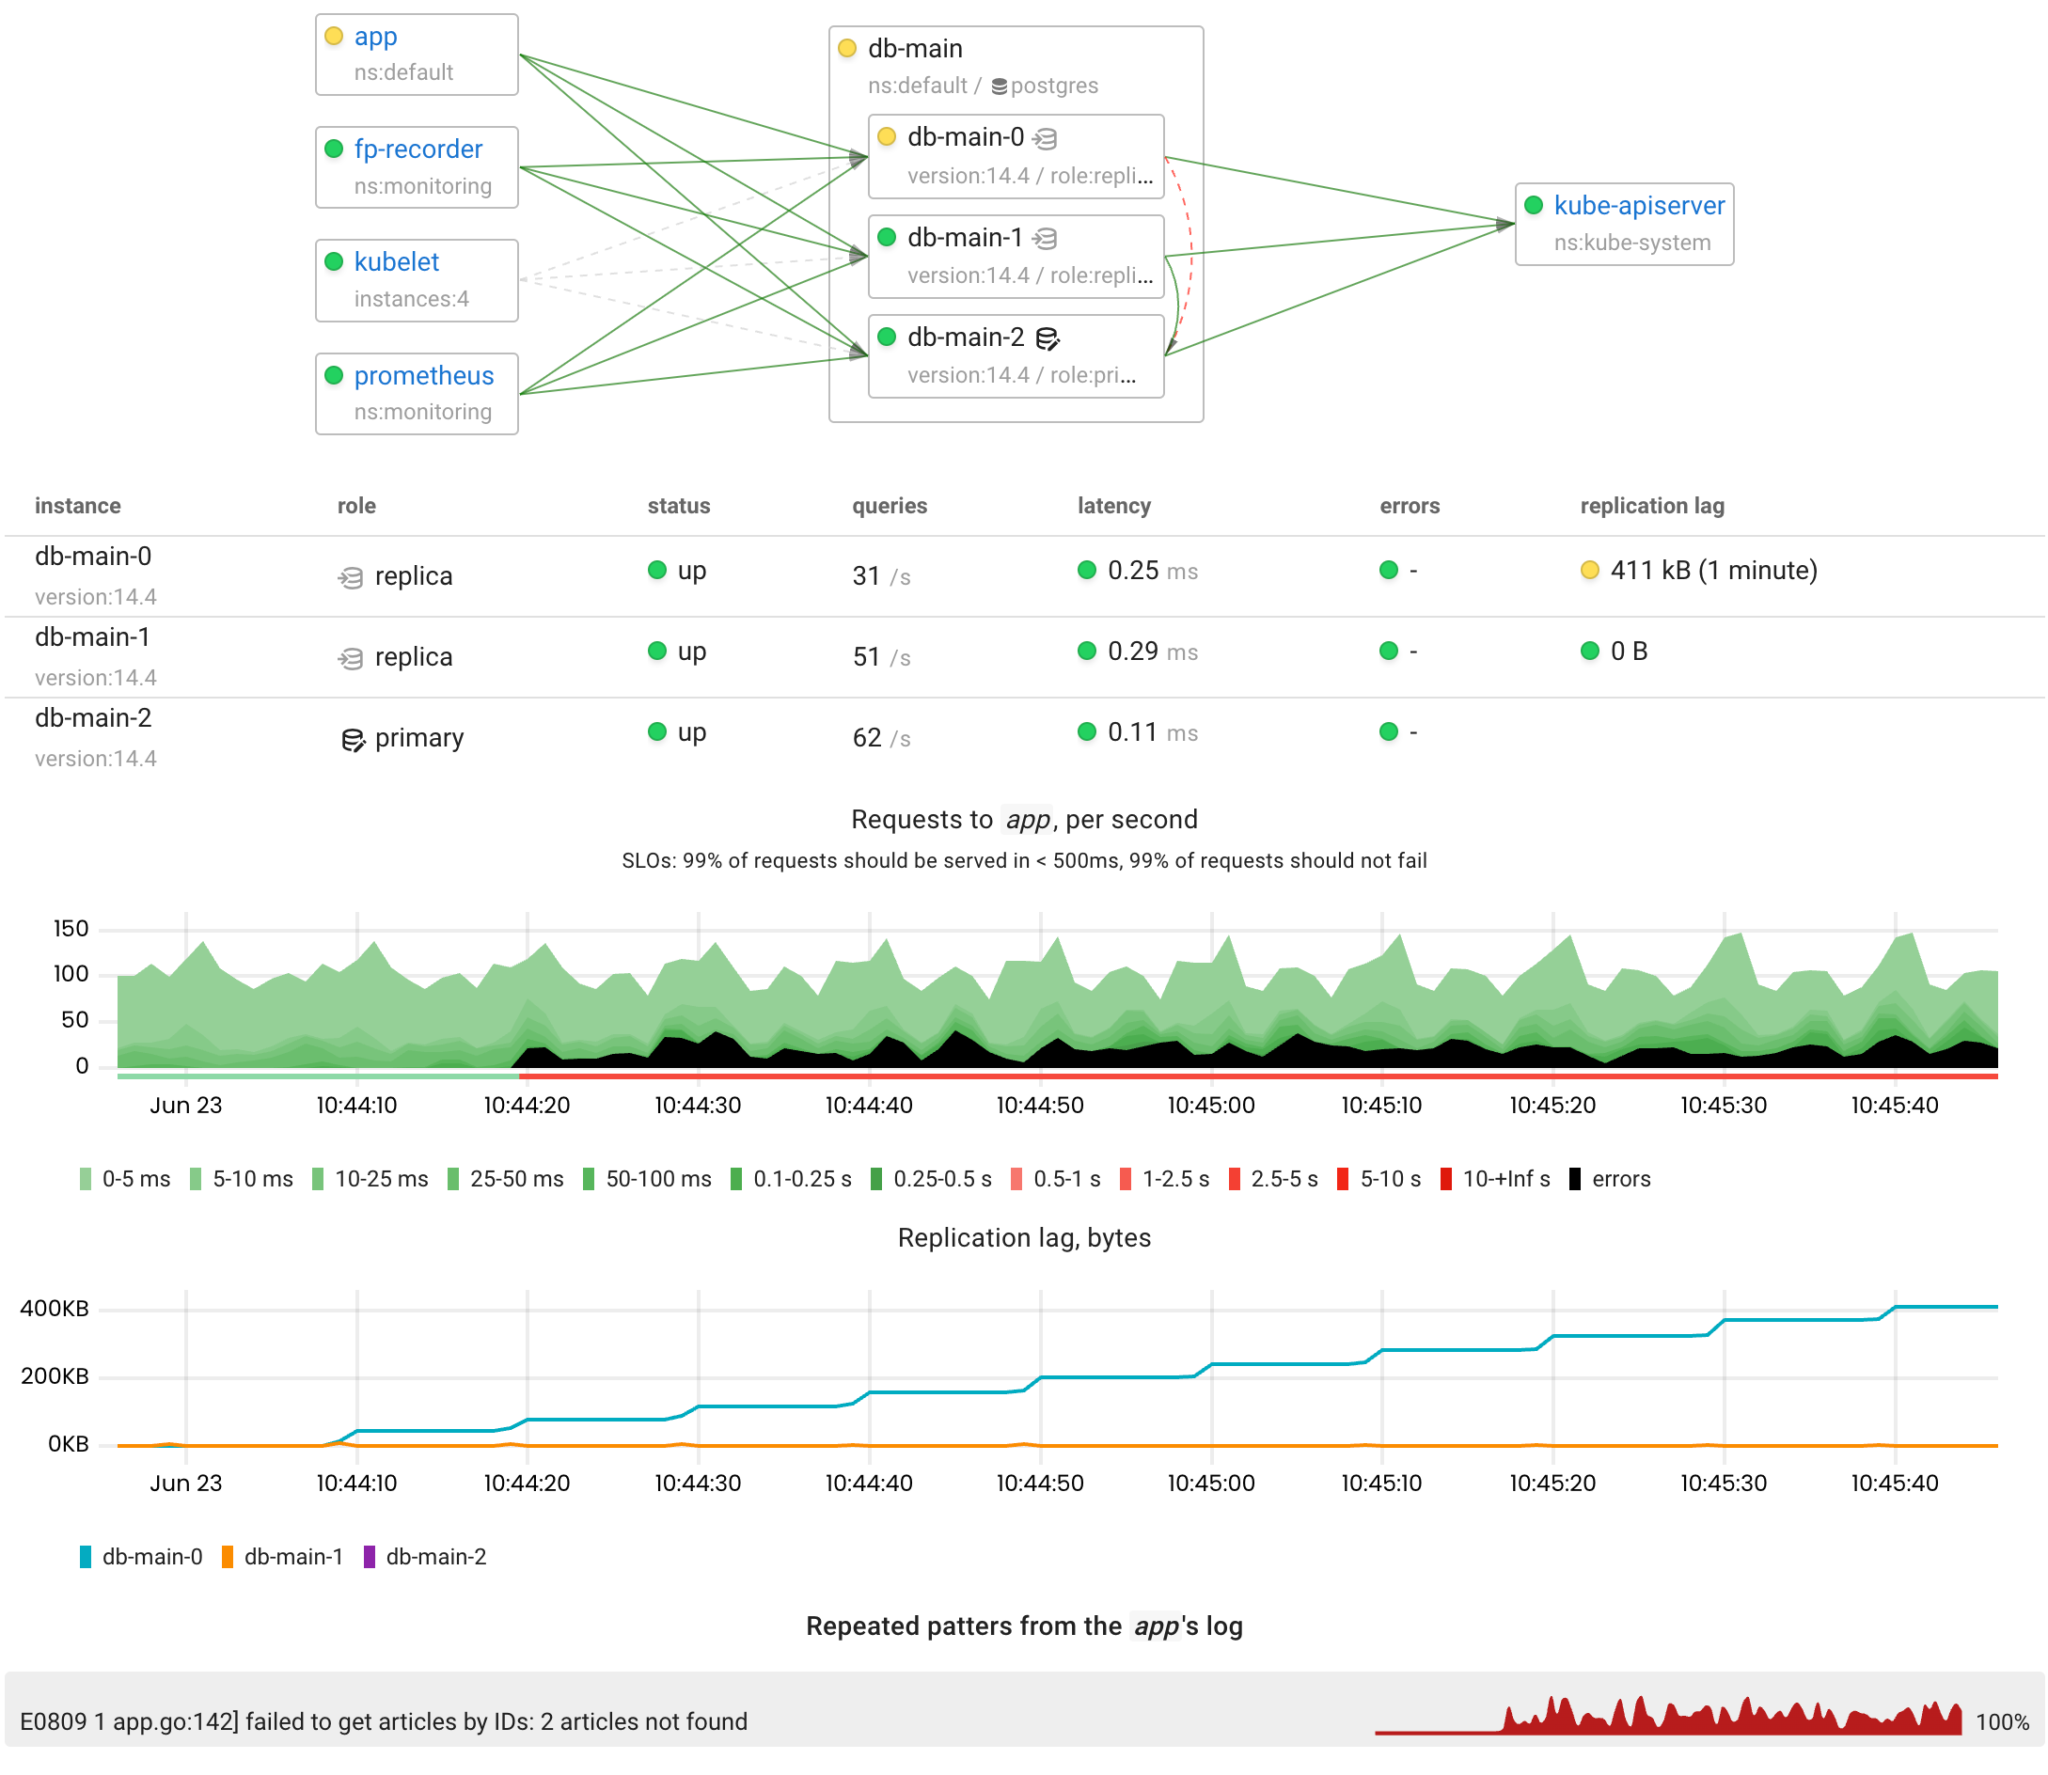
Unfortunately, the operator cannot handle such situations yet. In Patroni, there is the /replica?lag=<max-lag> health check endpoint which verifies that the lag of a particular replica is below the specified <max-lag>. However, it cannot be used as the readiness probe in the StatefulSet because it checks both the primary and the replicas. To address this a compound health check like /readiness?lag=<max-lag> could be implemented in Patroni to check the lag only when the instance is running as the replica.
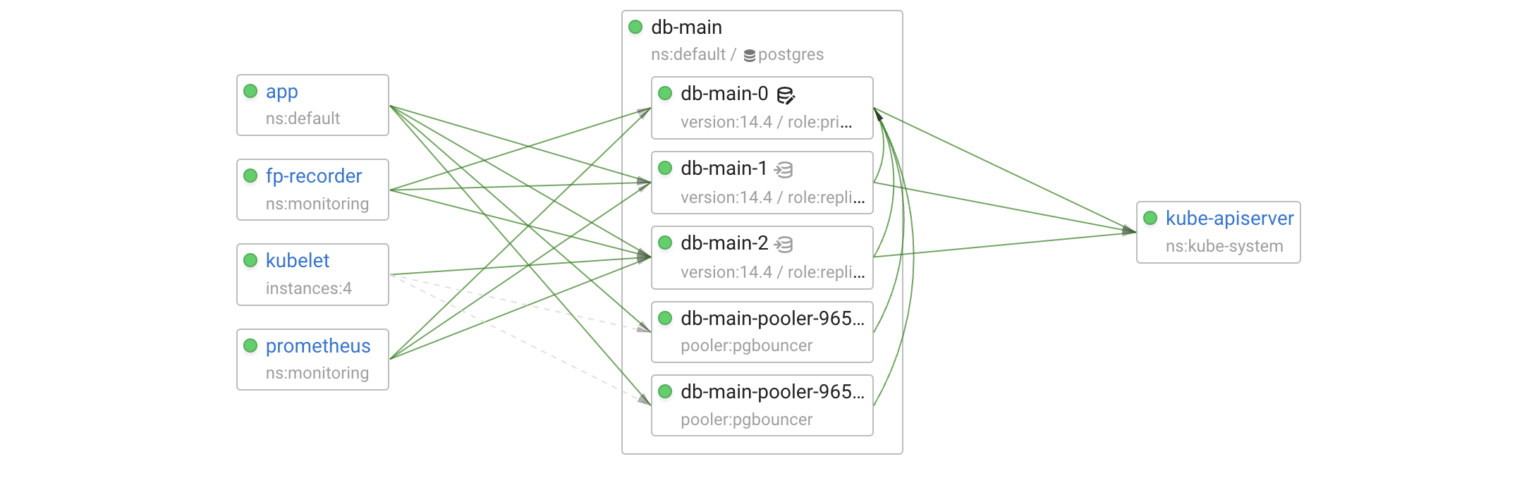
Connection pooler
Now, let’s add a connection pooler (PgBouncer) for the primary:
spec:
  enableConnectionPooler: true
  connectionPooler:
    numberOfInstances: 2
    mode: "session"
After applying the changes, the operator created the db-main-pooler Deployment and the relevant Kubernetes service.
The readiness probe of the pooler pods is tcp-socket :5432 delay=0s timeout=1s period=10s #success=1 #failure=3. So, if we completely isolate a pod, the failure will be handled by Kubernetes within 30 seconds. Let’s perform a more interesting experiment in which a pooler pod loses connectivity with Postgres but is still reachable by its clients.

kind: NetworkChaos
apiVersion: chaos-mesh.org/v1alpha1
metadata:
  name: pooler-net-partition
spec:
  selector:
    labelSelectors:
      connection-pooler: db-main-pooler
  mode: one
  action: partition
  direction: both
  target:
    selector:
      labelSelectors:
        application: spilo
        spilo-role: replica
    mode: all

As expected, such a failure is not handled automatically. However, it is fair to say that the probability of such an issue occurring is extremely low.
Bonus track: a major Postgres upgrade
The operator can handle major Postgres upgrades automatically. Depending on the major_version_upgrade_mode option, the operator can upgrade a particular cluster (manual) or all clusters (full).
Below are the main steps the operator performs to upgrade a cluster:
- changes the desired Postgres version in the database pods:
- performs a rolling update of the replicas [replicas downtime]
- initiates a switchover (planned failover) of the primary to one of the replicas [downtime]
- executes the /scripts/inplace_upgrade.py script (a part of Spilo) within the primary pod:
- checks the cluster health and runs sanity checks
- pauses Patroni for the cluster to disable automatic failover
- shuts down the primary Postgres [downtime]
- runs CHECKPOINT on the replicas [downtime]
- executes pg_upgrade on the primary to convert PGDATA to the desired Postgres version [downtime]
- shuts down the replicas [downtime]
- rsyncs PGDATA to the replicas [downtime]
- starts up the primary and replicas
- resumes Patroni for the cluster
- executes ANALYZE
Let’s upgrade the cluster to Postgres 14 and see how long it is unavailable for:
kubectl patch postgresql db-main --type='json' --patch='[{"op": "replace", "path": "/spec/postgresql/version", "value": "14"}]'
The initial rolling update caused 10 seconds of downtime due to the switchover. The downtime caused by the upgrade itself lasted 22 seconds.
Conclusion
Chaos engineering is fun! It not only allows you to test how well a service is able to tolerate failures but also to find out how observable your infrastructure is.
The conducted experiments verify that the Postgres operator and Patroni handle most failures perfectly. I hope this gives you more confidence to use them in production.
If you want to improve the observability of your infrastructure, give Coroot a chance!