Observability on Windows, before eBPF is production-ready
 Nikolay Sivko
No large enterprise runs a single stack. A shiny new Kubernetes cluster sits right next to a Windows Server box that has quietly run the billing system for a decade without missing a beat. Both keep the business running. Both deserve the same visibility.
Linux runs most server workloads, and Coroot grew up there. Our open-source node-agent uses eBPF to collect metrics, logs, traces, and profiles, with no code changes. But "most" is not "all". And the gaps are usually where the oldest, most critical systems live.
Coroot's promise is simple: see everything you run in one place. A corner labeled "Windows, good luck" quietly broke that promise.
Not completely. Coroot is OpenTelemetry-native, so any Windows app instrumented with the OpenTelemetry SDKs could always send its traces, metrics, and logs to Coroot, the same as from anywhere else. But that only covers the apps you can change. The node itself, and the services you cannot instrument by hand, stayed dark.
Closing that gap was our most requested integration by far. So here it is: the Coroot agent now runs on Windows.
It also has real limits, and the clearest way to see them is to take it in the order we built it, easy parts first.
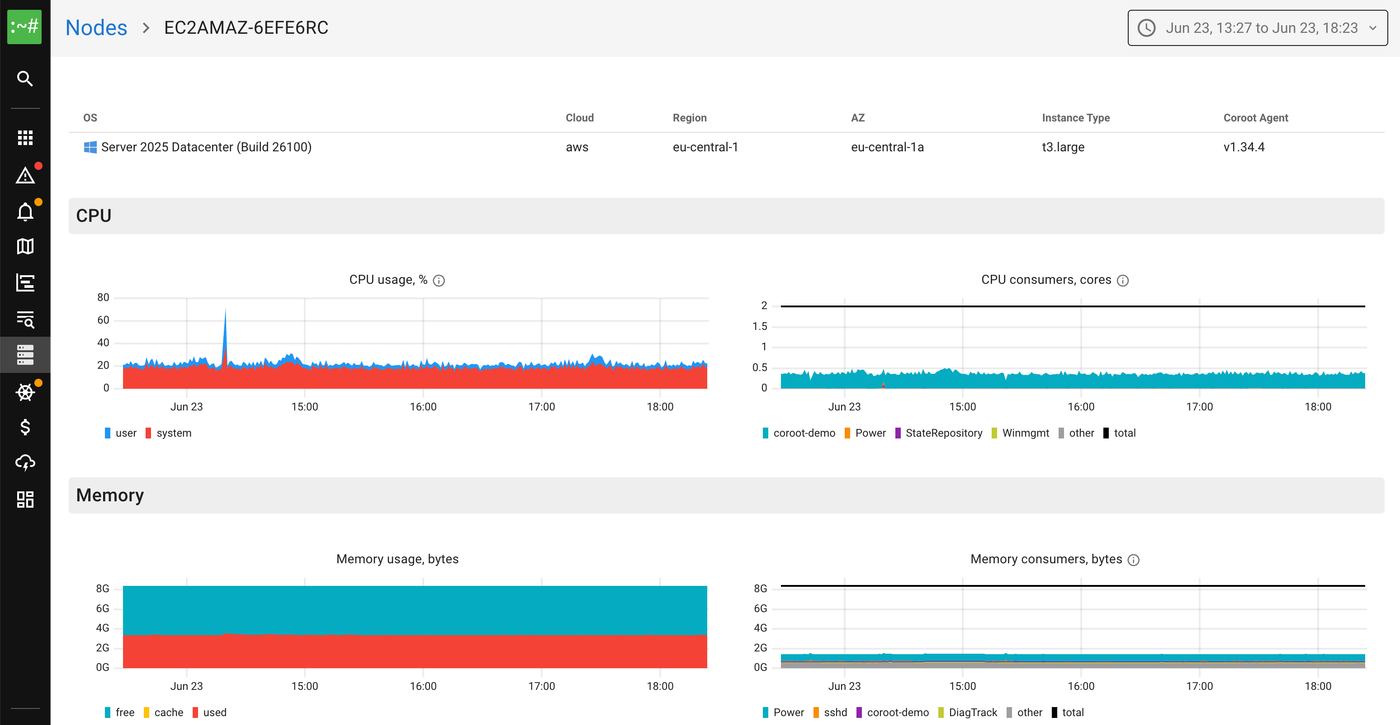
Start with the easy part: the node
The first job of any agent is to describe the machine it runs on. CPU, memory, disk, network. This part is roughly the same problem on every operating system.
Windows exposes all of it through standard APIs. The agent reads them and emits the same node_* metrics you already get on Linux. No tricks, no kernel magic. If all anyone wanted was host dashboards, we would have shipped in a day.
But a host is not why you run a monitoring tool. You run it for the things on the host.
What is an application? It is a container
Coroot describes the world in terms of containers. Every metric is attributed to a container, and an application is a group of containers. So the real question becomes: what is a container on this node?
On Linux, "container" is broader than Docker. It is really just a group of processes that belong together, tracked by a cgroup. That covers Docker, containerd, CRI-O, and LXC. It also covers plain systemd services, since each one is its own slice. The agent watches cgroups and groups processes accordingly.
Windows has no cgroups, so we had to choose the equivalent unit. We landed on two:
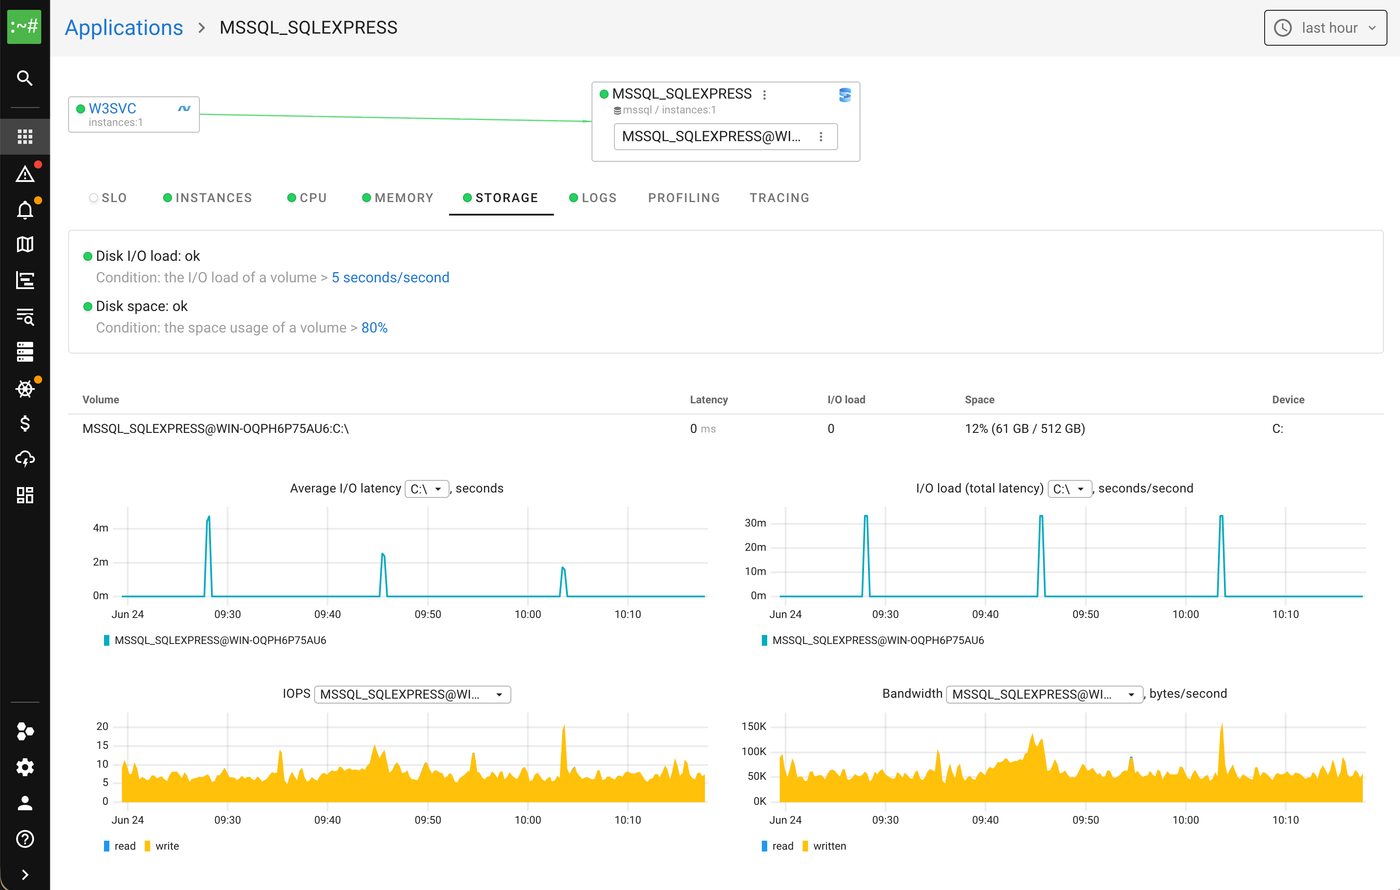
- Windows Services. Each service is a container, like
/win/W3SVCor/win/MSSQL_SQLEXPRESS. - Docker (Windows) containers, discovered through the Docker API.
Once you have identified the process group, collecting its resource metrics is the easy part again. CPU, memory, disk. Same idea as Linux, different APIs.
Docker has one catch. A Windows container runs in one of two modes:
- Process isolation. It shares the host kernel. We see its processes and collect everything.
- Hyper-V isolation. It runs in its own tiny VM with its own kernel. To the host, that VM is a sealed box. We cannot see inside it. So we report CPU and memory through the Docker API, and still place the container on the map by its IP, so edges pointing to it resolve.
So far, so manageable. Now the interesting part.
How do containers talk to each other?
A list of applications is useful. A map of how they depend on each other is far more useful. That map is the heart of Coroot.
To draw it, we need two things at the TCP level:
- Connection events: who connected to whom.
- Listening sockets: who listens on which address.
Put those together and the map builds itself. Match one container's outbound connection against another's listening socket, and an edge appears between them. No config, no naming conventions.
On Linux, eBPF is perfect for this. We hook the TCP lifecycle in the kernel and watch every connect, accept, and close as it happens.
On Windows, eBPF was not an option. There is a Microsoft eBPF for Windows project, and it is promising, but "promising" is not "bet the production fleet on it". Asking customers to load a young kernel extension just to get monitoring is a hard sell.
So we reached for ETW (Event Tracing for Windows). ETW is the operating system's own tracing engine, the one the built-in performance tools are built on, and it has been stable for years. We subscribe to kernel network ETW events to count TCP connects, both successful and failed. We read the current listening sockets and active connections by polling GetExtendedTcpTable. Put together, that tells us who is listening, who connected, and what is open right now. The agent stays a single, CGO-free Go binary, with nothing extra to install.
The output is identical to Linux, names and all:
# HELP container_net_tcp_successful_connects_total Total number of successful TCP connects
container_net_tcp_successful_connects_total{container_id="/win/java-db-app",destination="172.30.60.2:5432",actual_destination="172.30.60.2:5432"} 7
# HELP container_net_tcp_active_connections Number of active outbound connections used by the container
container_net_tcp_active_connections{container_id="/win/W3SVC",destination="127.0.0.1:1433",actual_destination="127.0.0.1:1433"} 1
# HELP container_net_tcp_listen_info Listen address of the container
container_net_tcp_listen_info{container_id="/win/coroot-demo",listen_addr="0.0.0.0:8080",proxy=""} 1
Containers complicate this, and the reason is isolation. On Linux, each container lives in its own network namespace. Windows has the same idea, called a network compartment. ETW does not care about it: its events reach our trace session from any compartment, each one tagged with a process id, so connection tracking just works. GetExtendedTcpTable does care. It only returns connections for the compartment the calling thread is in. So to read a container's listening sockets and active connections, the agent walks every compartment, switching its thread into each one, reading that compartment's table, then switching back. Because the compartment is a per-thread setting, it pins the goroutine to its OS thread while doing this.
Giving the map readable names: DNS
A map full of raw IP addresses is hard to read, so we also instrument DNS.
On Windows, that comes from the Microsoft-Windows-DNS-Client ETW provider. Every time a lookup finishes, we record the resolved addresses and build an IP-to-FQDN map. Connections then show real names instead of a wall of numbers.
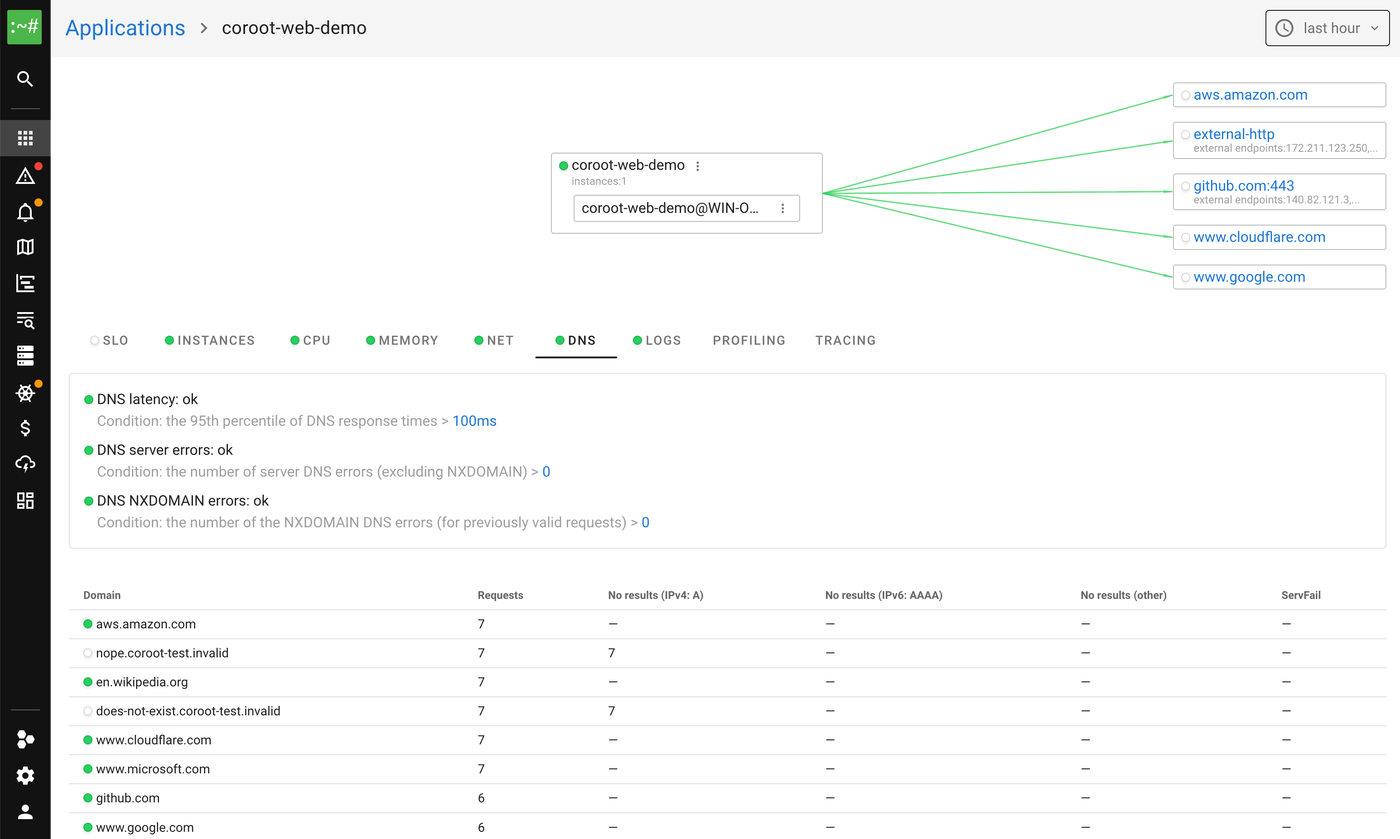
One detail saves you from a cardinality blowup. When a hostname resolves to many rotating public IPs (think S3 or a CDN), we collapse them all to the FQDN and drop the specific IP. The Coroot Linux agent already works this way, and we kept the behavior identical.
There is also a quirk worth knowing. A Windows container runs inside a server silo, the kernel-level isolation boundary that gives the container its own view of the system. The network compartment from earlier is one piece of it. A container's DNS queries are emitted inside that silo, and those events never cross into the host's ETW session. So container_dns_* works for host services, but not for DNS inside a container. We chased that as a "bug" for a while before realizing the OS was simply doing its job.
The wall: payloads and L7
Connections and DNS tell you the shape of a system. The next question is what actually flows through those connections.
On Linux, eBPF lets us read the bytes on the wire and parse application protocols: HTTP, Postgres, MySQL, Redis, Mongo, and more. That is where request rates, latency histograms, errors, and distributed traces come from.
This is where Windows stops us. ETW hands us events, not the payloads of arbitrary applications. We can see that service A talks to service B. We cannot, yet, see the requests between them.
That is not because it is impossible. There are ways to capture L7 on Windows, but each one is more invasive or narrower than the eBPF approach we trust on Linux. For a first release we chose to stop here, at the service map and connection health, and ship what is solid. A starting line, not a limit.
Logs just work
Not everything on Windows fights back. Logs are the part where it and Linux simply meet.
The agent pulls them from two places. It subscribes to the Windows Event Log and picks up entries as they are written. It also tails Docker container logs straight from the JSON files Docker writes to disk.
Everything after that is the same pipeline we run on Linux. Each message gets a severity. We extract recurring patterns and turn them into metrics, so a sudden spike or a brand-new pattern is easy to spot. We do not throw the raw messages away, though. They ship to Coroot over OTLP, each annotated with the pattern it matched, and land in ClickHouse, the same path a Linux log takes.
Open it up in Coroot and you cannot tell which world a log came from. Same severities, same patterns, same search, right next to the metrics from the same machine.
GPUs
Plenty of Windows machines run ML inference, rendering, or transcoding, and on those the GPU is the thing you watch. The agent reads NVIDIA cards through NVML (nvml.dll) and exports the device-level node_resources_gpu_* series: utilization, memory, temperature, and power. Enough to catch a saturated card, memory filling up, or a GPU throttling on heat. It does not yet attribute that usage to individual processes, the way the Linux agent does.
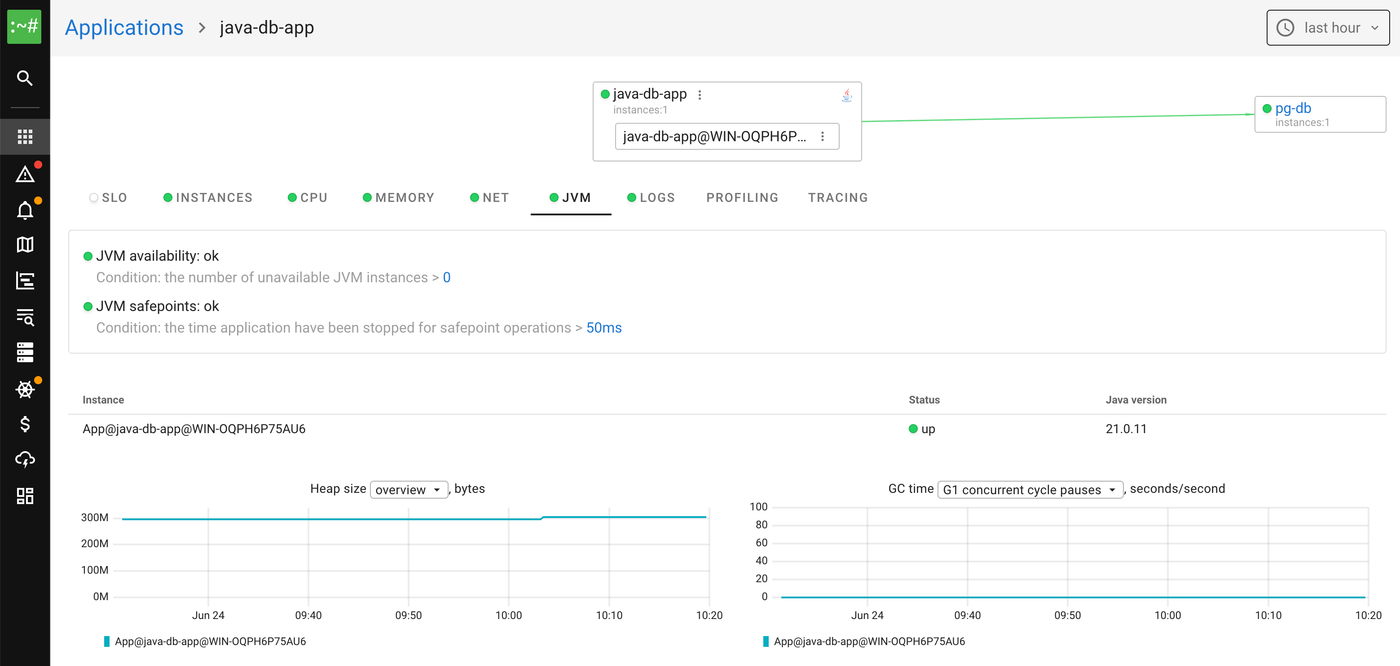
Java
A lot of enterprise software on Windows still runs on the JVM, and it was easy to bring along. The JVM writes its performance counters to a memory-mapped hsperfdata file, the same one jps and jstat read. The agent reads it directly, so heap usage and GC activity show up with no Java agent, no restart, and no change to the application.
Where each node runs
Knowing which cloud a node sits in, and which region and zone, is what lets Coroot make sense of topology. It is how nodes group by region and availability zone, and how the cost views know what an instance actually is. The valuable part is that none of it needs configuration. The agent discovers it on its own.
It works in two steps. First it identifies the cloud by reading SMBIOS, the firmware table that records the system manufacturer. Once it knows the provider, it calls that provider's instance metadata service, AWS IMDSv2 and the equivalents elsewhere, and asks for the specifics: region, availability zone, instance type, and the rest.
node_cloud_info{provider="AWS",region="eu-central-1",availability_zone="eu-central-1b",instance_type="t2.medium",...} 1
It is the same approach the Linux agent takes, so a Windows node drops into the same topology, in the right region and zone, with nothing to set up.
Why some services don't show up
Look closely and you will notice that not every Windows service appears in Coroot. That is on purpose. Showing all of them would be noise, not coverage, and noisy services are the ones that make alerts flap. So we are selective about what counts as an application.
The first rule is simple: we only watch services set to start automatically, the ones meant to be up around the clock. Manual and trigger-started services run on demand and then go quiet, so we skip them rather than let them flap.
Even among the always-on services, two cases need extra care. The first is the shared svchost.exe. Windows often packs several services into one svchost process and keeps no per-service breakdown of CPU or memory inside it. If four services share a process, there is no honest way to say which one used what. A service with no real numbers looks broken to Coroot, so we skip the ones that share a process. This is worst on Server 2016, but it still happens on Server 2025, so we handle it the same everywhere.
The second is ephemeral per-user service instances. Windows spins these up and tears them down constantly. As applications they would blink in and out and bury the alerts that actually matter, so we skip them too.
Linux vs Windows
| Capability | Linux | Windows |
|---|---|---|
| Node and container metrics (CPU, memory, disk, network) | Yes | Yes |
| Service map (connections and listens) | Yes | Yes |
| Logs | Yes | Yes |
| Cloud metadata | Yes | Yes |
| JVM metrics | Yes | Yes (hsperfdata) |
| GPU metrics | Yes | Yes (device-level) |
| DNS metrics | Yes | Host services only |
| L7 protocol metrics (HTTP, SQL, Redis, ...) | Yes | Not yet |
| Distributed tracing | Yes | Not yet |
| Continuous profiling (eBPF) | Yes | Not yet |
| Python and Node.js instrumentation | Yes | Not yet |
| Java profiling (async-profiler) | Yes | Not yet |
| .NET instrumentation | Yes | Not yet |
Try it in two minutes
The agent ships as an MSI, for x64 and arm64, and installs as a Windows service. From an elevated PowerShell:
$env:COROOT_COLLECTOR_ENDPOINT = 'http://COROOT_URL:8080'
$env:COROOT_API_KEY = '<API_KEY>'
iwr -useb https://raw.githubusercontent.com/coroot/coroot-node-agent/main/install.ps1 | iex
Environment variables are global on Windows, so the agent stays behind a COROOT_ prefix to avoid clashing with other software. Everything else maps to the same flags you already use on Linux. The full walkthrough is in the Windows installation guide.
No more blind spots
Here is what actually changes. Your Windows servers used to live in a separate tool, or in no tool at all. Now they show up on the same map as your Linux hosts and Kubernetes pods, with the same metrics, the same logs, and the same service map. When a Linux service talks to a Windows one, that dependency is right there on the map, instead of split across two tools. It is the single pane of glass we promised at the top, finally including the pane that was missing.
And it costs almost nothing to get there: one command, no kernel modules, nothing extra to run. The honest gap is L7, and that is next on our list as Windows tracing matures. If you run Windows in production, install the agent and tell us what hurts most. That is what decides where we go.