
Let's break autovacuum in Postgres: reproducing failures to make it observable
 Nikolay Sivko
Autovacuum is one of those Postgres background jobs that quietly keeps your database healthy. It cleans up the dead row versions that every UPDATE and DELETE leaves behind, and it keeps the database away from a hard transaction-ID limit that would take it offline. Most of the time you don't think about it, because it just works.
Until it doesn't. When autovacuum falls behind, nothing pages you. Tables bloat, queries slow down, the disk fills up, and transaction IDs get closer to wraparound. It's slow and quiet, which is what makes it easy to miss and hard to monitor well. The usual setup is a graph of dead rows piling up and a hope that someone notices when it looks wrong, but that number swings up and down by design, so it can't tell you whether autovacuum is keeping up or falling behind. Simple threshold alerts don't help either. Something like "not vacuumed in 2 hours" or "more than a million dead rows" mostly fires on big, busy tables that are perfectly healthy.
So let's do the thing we always do at Coroot: break it on purpose. We'll reproduce the common ways autovacuum fails, one at a time, and watch each one turn into a clear finding in Coroot that names the table, the cause, and the fix. For every signal I'll show which Postgres system view it came from, because that's the whole point. It's all already sitting in data Postgres hands you, you just have to collect the right bits.
A quick refresher: MVCC, dead tuples, and 32-bit transaction IDs
Postgres uses MVCC (Multi-Version Concurrency Control) so that readers never block writers. When you UPDATE a row, Postgres doesn't overwrite it in place. It writes a new version of the row and marks the old one as no longer visible to future transactions. DELETE does the same thing: the row is just marked dead, not physically removed. This is what lets a long-running SELECT keep seeing a consistent snapshot while other transactions modify the same rows.
The catch is that those dead row versions (dead tuples) pile up, and something has to come along later and reclaim the space. That something is VACUUM. It walks a table, finds tuples that are no longer visible to any running transaction, and frees them for reuse. Autovacuum is just Postgres running VACUUM for you automatically, in the background, once a table has accumulated enough dead tuples.
VACUUM has a second, less obvious job. Every transaction gets a 32-bit transaction ID (XID), which wraps around after ~4 billion transactions. Postgres uses the age of an XID to tell the past from the future, so to stop old XIDs from suddenly looking like they're in the future, VACUUM "freezes" old rows, stamping them as permanently visible. If freezing doesn't keep up, the XID age climbs toward the wraparound limit, and Postgres will start emitting warnings and eventually refuse new writes to protect your data. This is the dreaded transaction ID wraparound, and it has caused real outages.
So autovacuum quietly does two critical things: it keeps bloat in check, and it keeps you away from the wraparound cliff. Both fail silently, which is exactly the kind of thing observability is for. (The same daemon also runs ANALYZE to keep the query planner's stats fresh, but that's a latency problem rather than a bloat one, so we'll save it for another post.)
Why "dead tuples" alone is a bad signal
So how do you tell whether autovacuum is keeping up? The obvious answer is to watch the number of dead rows, and that's exactly where most monitoring goes wrong. Almost every Postgres dashboard just graphs n_dead_tup (the dead-row count) and stops there.
The problem is that on a healthy table this number is supposed to go up and down. It climbs as you write, autovacuum cleans up, it drops, and round it goes again. A big number isn't bad by itself. 5 million dead rows in a 500-million-row table is nothing. The same 5 million in a 6-million-row table means half the table is dead weight. The raw count can't tell those two apart, so any alert you set on it is either too noisy or too loose.
Postgres itself doesn't use the raw count either. It decides to autovacuum a table when:
n_dead_tup >= autovacuum_vacuum_threshold + autovacuum_vacuum_scale_factor * n_live_tup
With the defaults (threshold = 50, scale_factor = 0.2), that's "50 rows plus 20% of the table." The right side of that formula is the number that actually matters. It's the point where autovacuum should kick in. So instead of graphing the raw count, we divide one by the other:
autovacuum pressure = n_dead_tup / (threshold + scale_factor * n_live_tup)
Now the table size cancels out. A healthy table hovers around 1.0. A table stuck at 5 has five times more dead rows than the level where autovacuum should have cleaned it up, so it's falling behind, whether the table is tiny or huge.
Pressure is a great signal, but it has one weak spot. A tiny table can shoot up to a huge ratio and still not matter. So Coroot uses two signals at once. It only raises a finding when a table is both over a pressure threshold (default 2x) and holding a real amount of dead data (at least 512 MiB). Pressure says "this table is genuinely behind." The size check says "and it's big enough to care about." Together they cover each other's weak spot.
Step 1: detect that a table is behind
Everything starts from the pressure signal, and pressure needs three numbers per table: dead tuples, live tuples, and the on-disk size for the materiality gate. All of it comes from pg_stat_user_tables, joined to pg_class:
SELECT s.schemaname, s.relname, s.n_dead_tup, s.n_live_tup,
       (s.n_dead_tup::float8 / NULLIF(s.n_live_tup + s.n_dead_tup, 0) * pg_relation_size(s.relid))::bigint,
       EXTRACT(EPOCH FROM now() - s.last_autovacuum),
       array_to_string(c.reloptions, ',')
FROM pg_stat_user_tables s
JOIN pg_class c ON c.oid = s.relid
WHERE s.n_dead_tup > 0
ORDER BY 5 DESC NULLS LAST
LIMIT 20
That ORDER BY ... LIMIT 20 matters. We don't collect per-table metrics for every table, only the top 20 by dead-tuple bytes, which keeps cardinality sane on databases with thousands of tables. And because we sort by exactly the quantity the check cares about, any table with enough dead data to be a problem is always in that set. A table that isn't in the top 20 by dead bytes isn't the one that's going to page you.
The first three columns are all detection needs. They become:
pg_table_dead_tuples/pg_table_live_tuples: the raw counts, so pressure can be computed on the backendpg_table_dead_tuple_bytes: dead rows in bytes, for the materiality gate and the "how much is reclaimable" number
When pressure stays above the threshold (default 2x) on a table that's also holding a material amount of dead data (≥ 512 MiB), we know something is wrong and raise the check. That's the what. The last two columns of that query (last_autovacuum and reloptions) we'll use in the next step.
Step 2: figure out why
Detecting the problem was the easy half. The half that actually helps is answering why a table is stuck, because the fix is totally different depending on the reason. Good news: there are only a few of them, and each one leaves a fingerprint.
| Why the table is stuck | How we detect it |
|---|---|
| Autovacuum is disabled on the table | autovacuum_enabled=false in the table's reloptions |
| Something holds the vacuum horizon (a transaction, a replication slot, a standby) | table was vacuumed recently, yet pressure stays high, and there's an old xmin holder |
| All autovacuum workers are busy | running workers ≈ autovacuum_max_workers |
| A vacuum is running but throttled | an in-progress vacuum parked on the VacuumDelay wait event |
The first cause we already get from Step 1, for free. The reloptions we read there tell us whether autovacuum has been switched off on a table. We expose them as pg_table_setting, a small per-table metric that carries any overrides as labels: autovacuum_enabled, autovacuum_vacuum_scale_factor/threshold, and autovacuum_vacuum_cost_delay/limit.
Step 1 gives us one more thing that every answer below leans on: pg_table_seconds_since_last_autovacuum, how long ago the table was last vacuumed. If a table is behind but was vacuumed just seconds ago, autovacuum obviously is running. It isn't asleep, so something must be stopping it from finishing the job.
The "vacuum horizon" case needs one extra piece: not just that the horizon is stuck, but who is holding it there. Postgres won't delete a dead row while it's still visible to the oldest snapshot anywhere in the system, and that snapshot can come from four different places. We measure how old the oldest one from each source is and emit them all as pg_oldest_xmin_age{holder=...} (the same numbers feed the wraparound check):
SELECT
  (SELECT COALESCE(max(age(backend_xmin)), 0) FROM pg_stat_activity
     WHERE backend_xmin IS NOT NULL AND backend_type = 'client backend'),  -- running_transaction
  (SELECT COALESCE(max(age(backend_xmin)), 0) FROM pg_stat_activity
     WHERE backend_xmin IS NOT NULL AND backend_type = 'walsender'),        -- standby_feedback
  (SELECT COALESCE(max(GREATEST(age(xmin), age(catalog_xmin))), 0)
     FROM pg_replication_slots),                                            -- replication_slot
  (SELECT COALESCE(max(age(transaction)), 0) FROM pg_prepared_xacts)        -- prepared_transaction
Four holders, four totally different fixes: an app transaction someone left open, a standby feeding its xmin back through hot_standby_feedback, a replication slot, or a two-phase (prepared) transaction nobody ever committed. So when a table is behind, was vacuumed recently, and one of these is old, we've found our culprit, and the finding says which one.
That leaves two causes, and each needs a query of its own.
Is a vacuum running, and is it being throttled? For that we look at pg_stat_progress_vacuum (the vacuum that's running right now) and join it to pg_stat_activity to check whether the worker is asleep on the cost limiter:
SELECT n.nspname, c.relname, COALESCE(a.wait_event = 'VacuumDelay', false)
FROM pg_stat_progress_vacuum p
JOIN pg_class c ON c.oid = p.relid
JOIN pg_namespace n ON n.oid = c.relnamespace
LEFT JOIN pg_stat_activity a ON a.pid = p.pid
One gotcha here that's easy to lose an afternoon to: pg_stat_progress_vacuum.relid only resolves through pg_class inside the same database. Run it on the wrong connection and you get zero rows and no error at all. So the agent runs it per-database. This gives us pg_table_vacuum_in_progress and pg_table_vacuum_throttled.
And how many workers are busy? We just count the backends in pg_stat_activity whose backend_type is 'autovacuum worker' and expose it as pg_autovacuum_workers. Line that up against autovacuum_max_workers and you can see the moment autovacuum runs out of hands.
That's the whole toolkit: one query to spot trouble, a few more signals to explain it. Time to start breaking things.
Setting up the environment
The setup is a Postgres cluster monitored by Coroot, with the cluster-agent collecting the metrics above. To make dead tuples on demand I use a few test tables, wsat_1 through wsat_4, each around 2 million rows (~2 GB) with a throwaway filler column. Rewriting every row turns the whole table into dead tuples in one shot:
UPDATE wsat_1 SET filler = filler; -- 2M rows rewritten, 2M dead tuples
Under normal conditions autovacuum eats those dead tuples within a minute or two and the table's pressure drops back toward 1. For each failure below, we'll sabotage a different part of that loop and watch Coroot call it out.
Failure #1: autovacuum turned off on a table
This one is depressingly common. Someone had a batch job that was fighting with autovacuum, so they "temporarily" disabled it on a table:
ALTER TABLE wsat_1 SET (autovacuum_enabled = false);
...and then never turned it back on. Now dead tuples accumulate forever. Nothing cleans them up, the table bloats without bound, and because freezing also stops, that table drifts toward wraparound.
Rewrite the rows a few times and pressure climbs and never comes back down, because no vacuum ever runs. Coroot raises the Postgres autovacuum check with a finding that names the table and the reason, pulled straight from that reloption we read out of pg_class:
autovacuum is falling behind on 1 postgres instance postgres-products-2: products.wsat_1: 9x over the autovacuum trigger threshold, ~2GB of dead rows; autovacuum is disabled on this table (autovacuum_enabled=false)
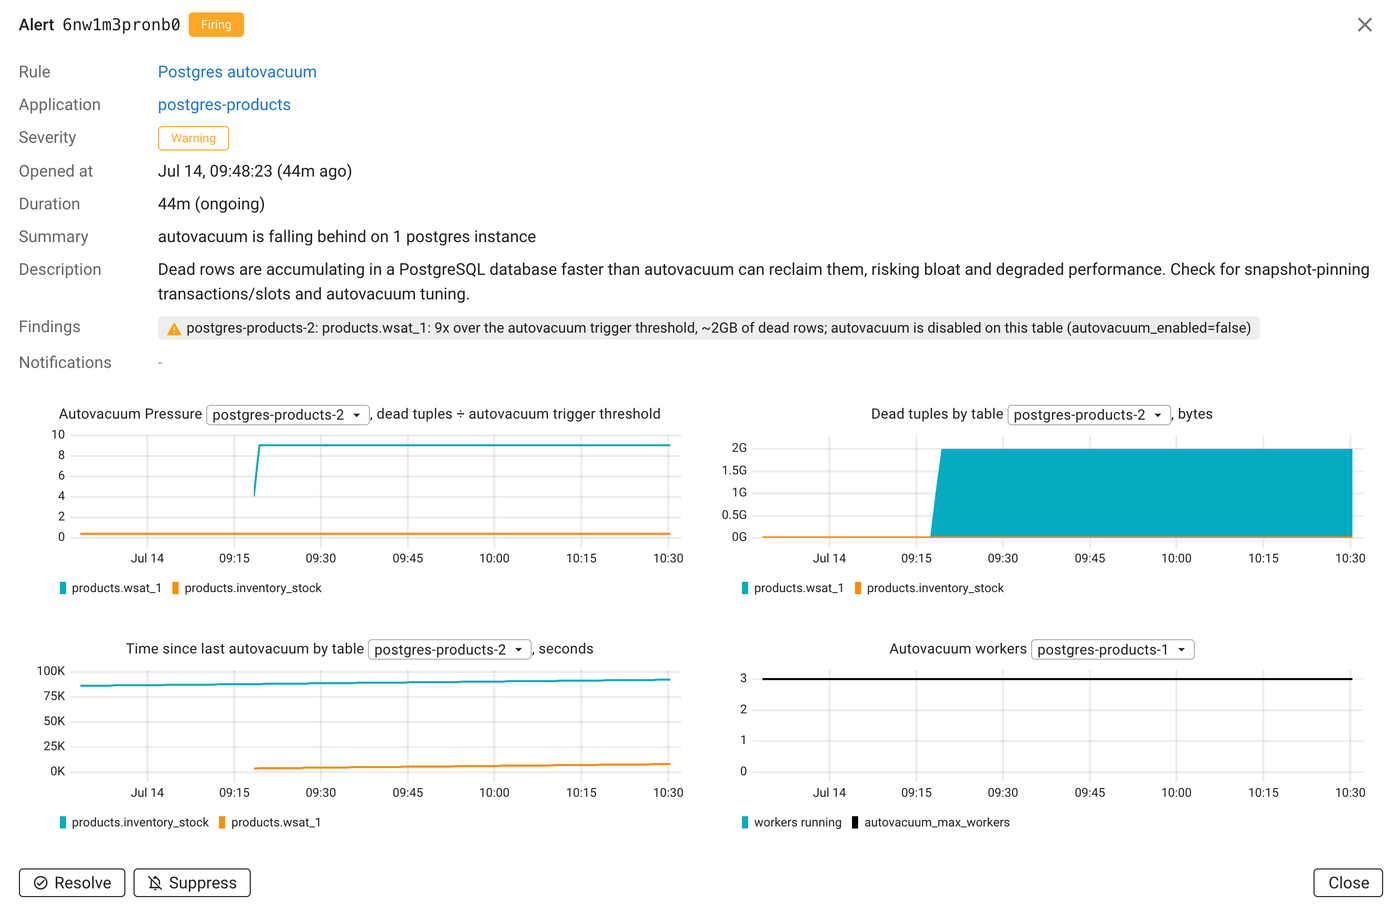
No digging through system tables by hand. The finding already tells you the fix. Turn autovacuum back on and pressure drops back to normal:
ALTER TABLE wsat_1 RESET (autovacuum_enabled);
Failure #2: a long transaction holds the vacuum horizon
Here's the sneaky one. Autovacuum is running fine, on schedule, doing everything right, and dead tuples still pile up. Why? Because VACUUM can only remove a dead tuple once it's invisible to every running transaction. If a single old transaction is still open, its snapshot pins the "vacuum horizon," and every dead tuple newer than that transaction is untouchable, across the whole database, not just the table that transaction cares about.
The classic culprit is a connection stuck idle in transaction: an app that opened a transaction, ran a query, and then went off to do something slow (or crashed) without committing:
BEGIN ISOLATION LEVEL REPEATABLE READ;
SELECT 1;  -- grabs a snapshot and holds it
-- ...and the connection just sits here, forever
The isolation level matters here. A REPEATABLE READ transaction keeps its snapshot until it ends, so while it sits idle the horizon can't move. (A plain SELECT in the default READ COMMITTED level lets go of its snapshot the moment the query finishes, so on its own it wouldn't pin anything. The other common offender is a transaction that has written something and then stalled before committing.)
Now rewrite the rows of wsat_1. Autovacuum will happily run (you'll see it run), but the dead tuples won't drop, because it's not allowed to remove them.
This is where the "seconds since last autovacuum" signal earns its keep. Coroot sees that the table was vacuumed recently and yet pressure is still high, which rules out "autovacuum isn't running" and points at the real cause. It cross-references the oldest held-back transaction (we already track the xmin horizon and who's holding it for the wraparound check) and reports:
autovacuum is falling behind on 1 postgres instance postgres-products-2: products.wsat_1: 4x over the autovacuum trigger threshold, ~1GB of dead rows; a running transaction is blocking cleanup (holds the vacuum horizon)
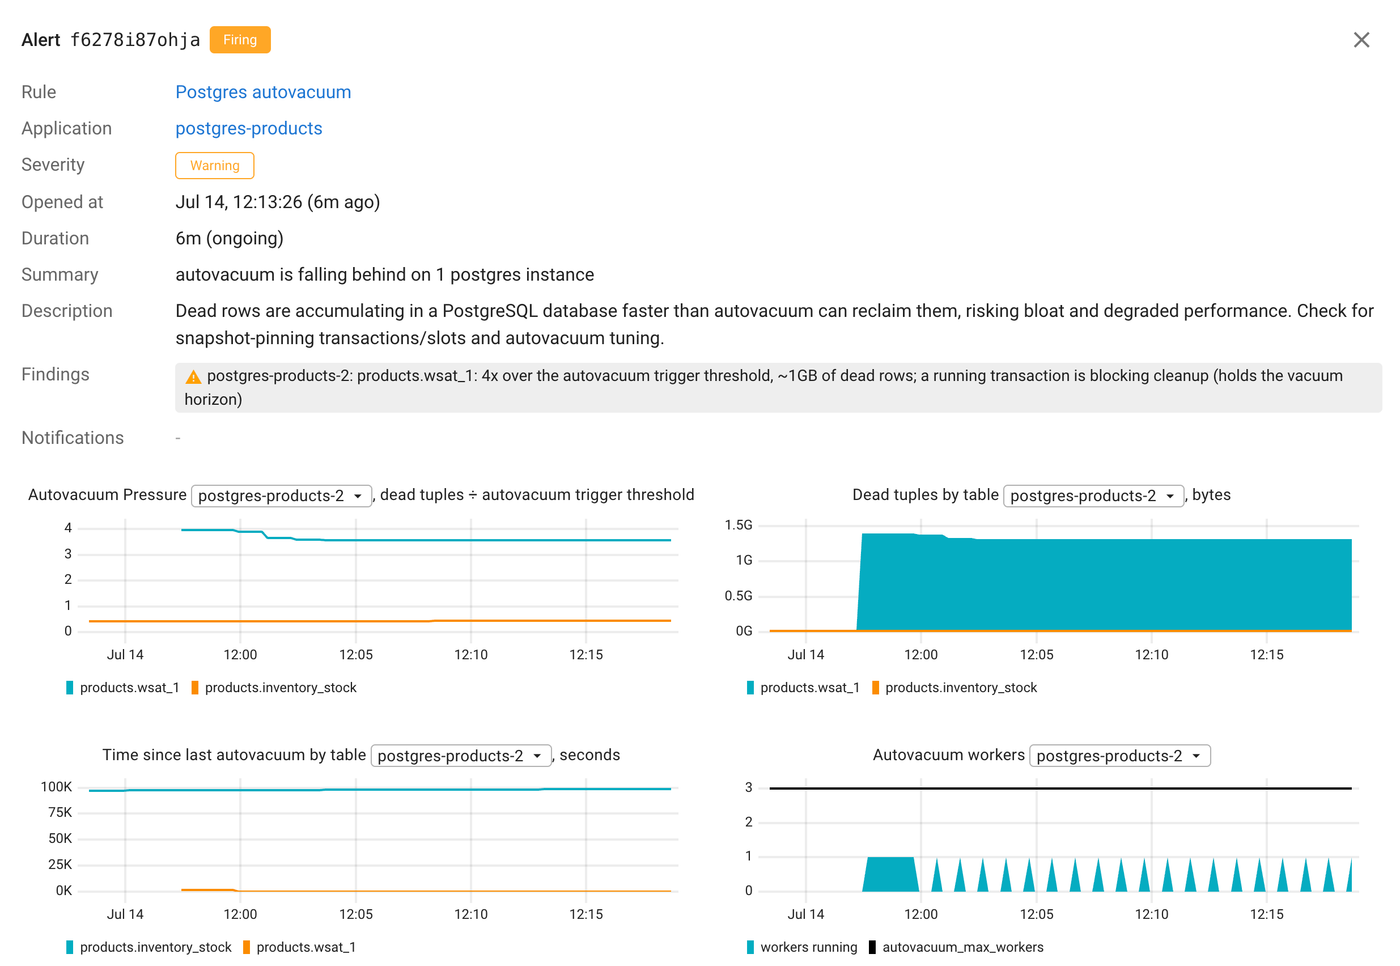
The finding points at the cause, not just the symptom: an open transaction is holding the horizon. To see which one, the idle-transactions charts sit right there in the alert view, showing a single session open for the whole window. That select ? is exactly the SELECT 1 we ran, with its values obfuscated (Coroot normalizes query text so it can group statistics safely).
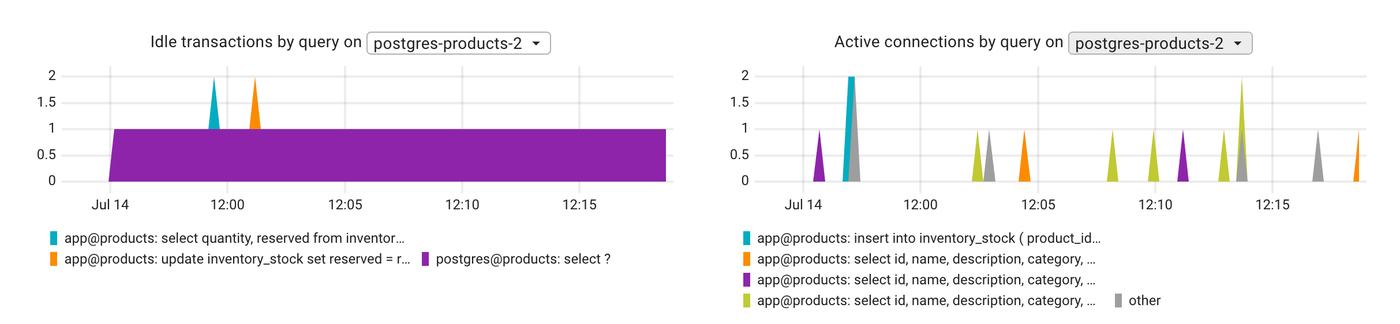
The fix is to close or kill that connection, not to tune autovacuum. Once it's gone, the next vacuum reclaims everything.
Failure #3: a fenced replica leaves a slot pinning the horizon
A stuck client transaction isn't the only thing that can hold the horizon back. A replica can do it too, through a setting called hot_standby_feedback.
Here's what that setting is for. If you run read queries on a replica, they can get cancelled out from under you. The replica is constantly replaying the primary's WAL, and if the primary vacuums away a row that a replica query is still reading, the replica kills that query with canceling statement due to conflict with recovery. Turning on hot_standby_feedback fixes it: the replica tells the primary the oldest row version its queries still need, and the primary keeps its vacuum horizon from moving past that point. The queries survive. It's a common, sensible thing to enable, especially when you offload reporting or analytics onto replicas.
The primary stores that promised xmin in the replica's physical replication slot. So now the replica's queries are quietly holding back cleanup on the primary, which is fine while everything is healthy.
Then the network between them is cut: a fencing event, a partition, a dead node. The replica is gone, but its slot isn't. The slot stays on the primary, goes inactive, and freezes at the last xmin the replica ever reported. The primary keeps working, that frozen xmin keeps aging, and cleanup is now stuck behind a replica that no longer exists. That is the whole danger of a slot: bare hot_standby_feedback would be forgotten the instant the replica disconnected, but the slot makes the pin outlive it.
This is the case that's genuinely hard to catch by hand, because there's nothing to see in pg_stat_activity: once the orphaned walsender times out and exits, no query is running, no connection looks stuck, and standby_feedback drops to zero. The only trace left is a frozen xmin sitting in pg_replication_slots, quietly aging as the primary keeps working.
To reproduce, cut the network between the primary and a feedback-enabled replica (a NetworkPolicy, a firewall rule, or a Chaos Mesh partition all do the job), then keep writing on the primary:
-- on the primary, once the replica is fenced
UPDATE wsat_1 SET filler = filler;
Autovacuum on the primary keeps running, but pressure climbs and never drops, because the slot's frozen xmin won't let it remove anything. And since the walsender is gone, the slot is the only holder left, so Coroot attributes it unambiguously:
autovacuum is falling behind on 1 postgres instance postgres-products-1: products.wsat_1: 3x over the autovacuum trigger threshold, ~1GB of dead rows; a replication slot is blocking cleanup (holds the vacuum horizon)
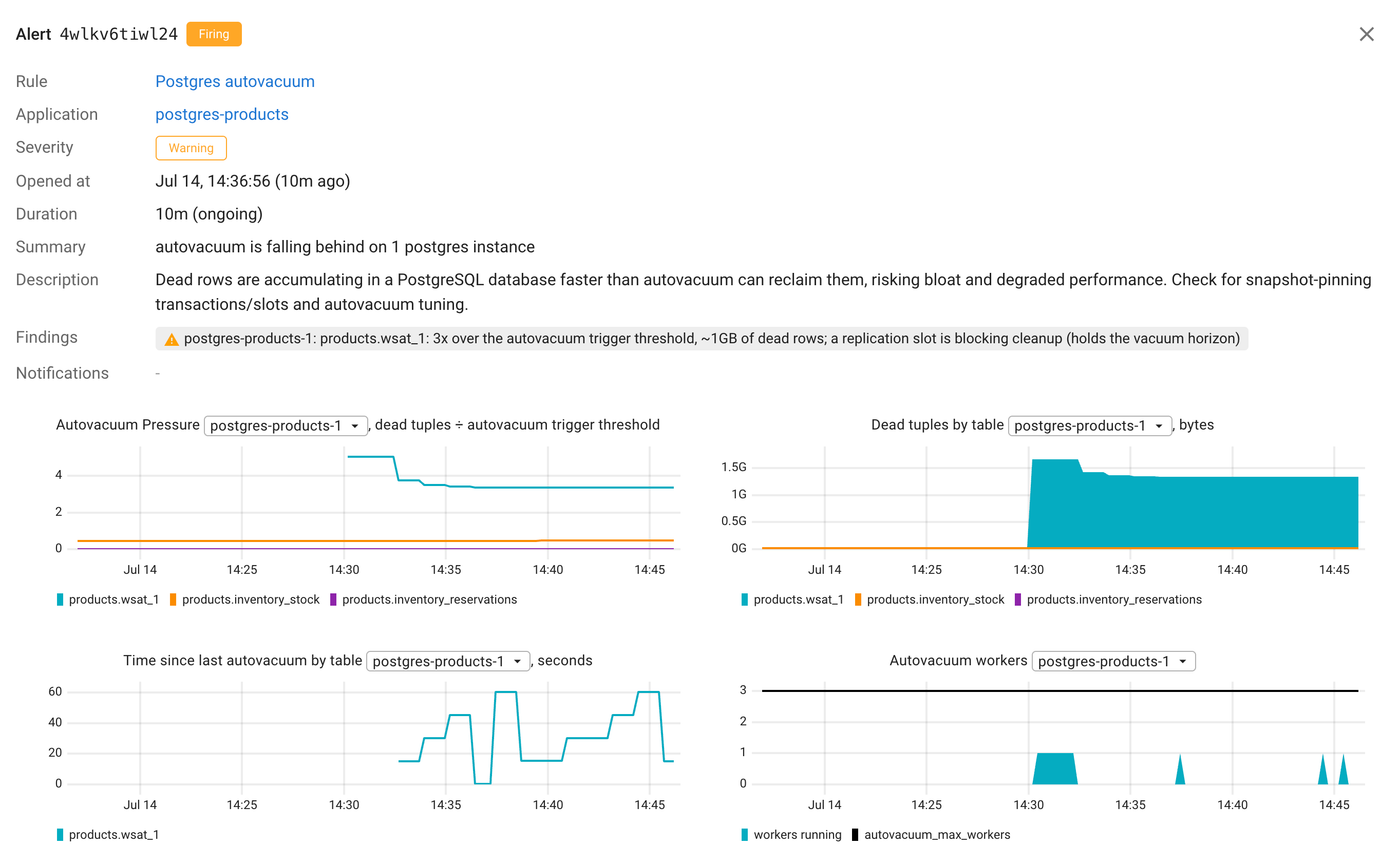
Because we track the horizon age by holder, the finding points straight at the slot rather than "something old is in the way." You can see it in the holders chart: only the replication slot climbs, while running transactions and standby feedback stay flat at zero.

The fix isn't on the primary at all: reconnect the replica so the slot advances, or drop the slot if that replica is never coming back. And it's the same inactive slot that piles up WAL on the primary and can fill the disk, shown climbing in the retained-WAL chart above, which Coroot flags separately on the storage side. One forgotten slot lights up wherever it's doing damage: dead-tuple cleanup, disk, or both.
Failure #4: all the workers are busy
Postgres only runs a few autovacuum workers at a time (autovacuum_max_workers, three by default). If enough big, busy tables need vacuuming at once, the workers can't get to them all. Tables wait in line, and the ones at the back keep piling up dead tuples while they wait. The fix is more workers, which is exactly what the finding tells you.
To show this at demo scale I did the opposite and dropped to a single worker:
ALTER SYSTEM SET autovacuum_max_workers = 1; -- requires a restart
It's the same problem either way: more tables need vacuuming than there are workers to do it. With one worker, a handful of churning tables is enough to keep it busy while the rest starve. The Autovacuum workers chart makes it obvious, with the running-workers line sitting right at the autovacuum_max_workers limit:
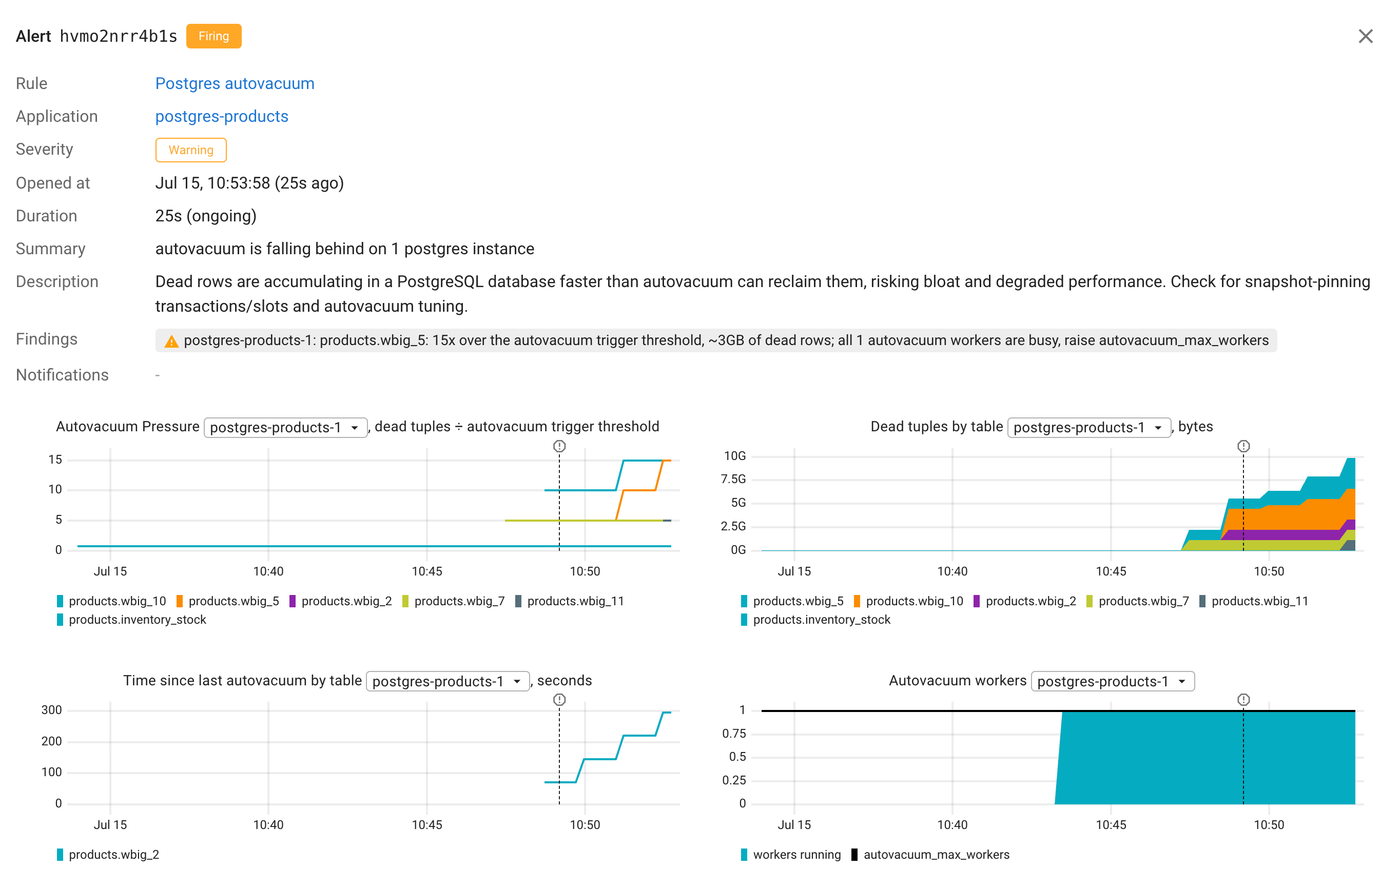
Coroot sees that a table is behind, hasn't been vacuumed in a while, and every worker is busy, so it names the cause:
autovacuum is falling behind on 1 postgres instance postgres-products-1: products.wbig_3: 15x over the autovacuum trigger threshold, ~3GB of dead rows; all 1 autovacuum workers are busy, raise autovacuum_max_workers
In production you'd see the same finding with three or more workers, once the workload outgrows them. And Coroot only tells you to raise autovacuum_max_workers when that's really the problem: the workers are full and this table starved as a result. That matters, because in the next failure the workers are busy too, but adding more wouldn't help.
Failure #5: vacuum is running, just crawling
Autovacuum has a built-in brake. To avoid hammering your disks, each worker accumulates a "cost" as it reads and dirties pages, and once it hits autovacuum_vacuum_cost_limit, it sleeps for autovacuum_vacuum_cost_delay milliseconds. On modern SSDs the defaults are often far too conservative, and on a big table a throttled vacuum can crawl so slowly that it never catches up with incoming writes.
The trap here is that everything looks fine: vacuums are running, workers are busy. But the vacuums are asleep more than they're working. Let's force it by cranking the delay way up on a few tables, so every worker ends up throttled:
ALTER TABLE wsat_1 SET (autovacuum_vacuum_cost_delay = 100);  -- sleep 100ms every cost_limit
ALTER TABLE wsat_2 SET (autovacuum_vacuum_cost_delay = 100);
ALTER TABLE wsat_3 SET (autovacuum_vacuum_cost_delay = 100);
Now churn all three. A vacuum starts on each, but every one spends most of its life parked on the VacuumDelay wait event. The only reliable way to know it's being throttled, as opposed to just being slow on bad storage, is that wait event, which is exactly why we join pg_stat_progress_vacuum to pg_stat_activity. We sample it and average the throttled indicator over the window (a heavily throttled vacuum sits in VacuumDelay ~99% of the time, so we catch it even at a 15s scrape interval).
Coroot distinguishes "throttled" from "just slow," and because the delay came from a per-table reloption, it even points at the specific setting to change:
autovacuum is falling behind on 1 postgres instance postgres-products-1: products.wsat_2: 3x over the autovacuum trigger threshold, ~2GB of dead rows; vacuum throttled by this table's cost_delay=100ms, adjust the cost settings
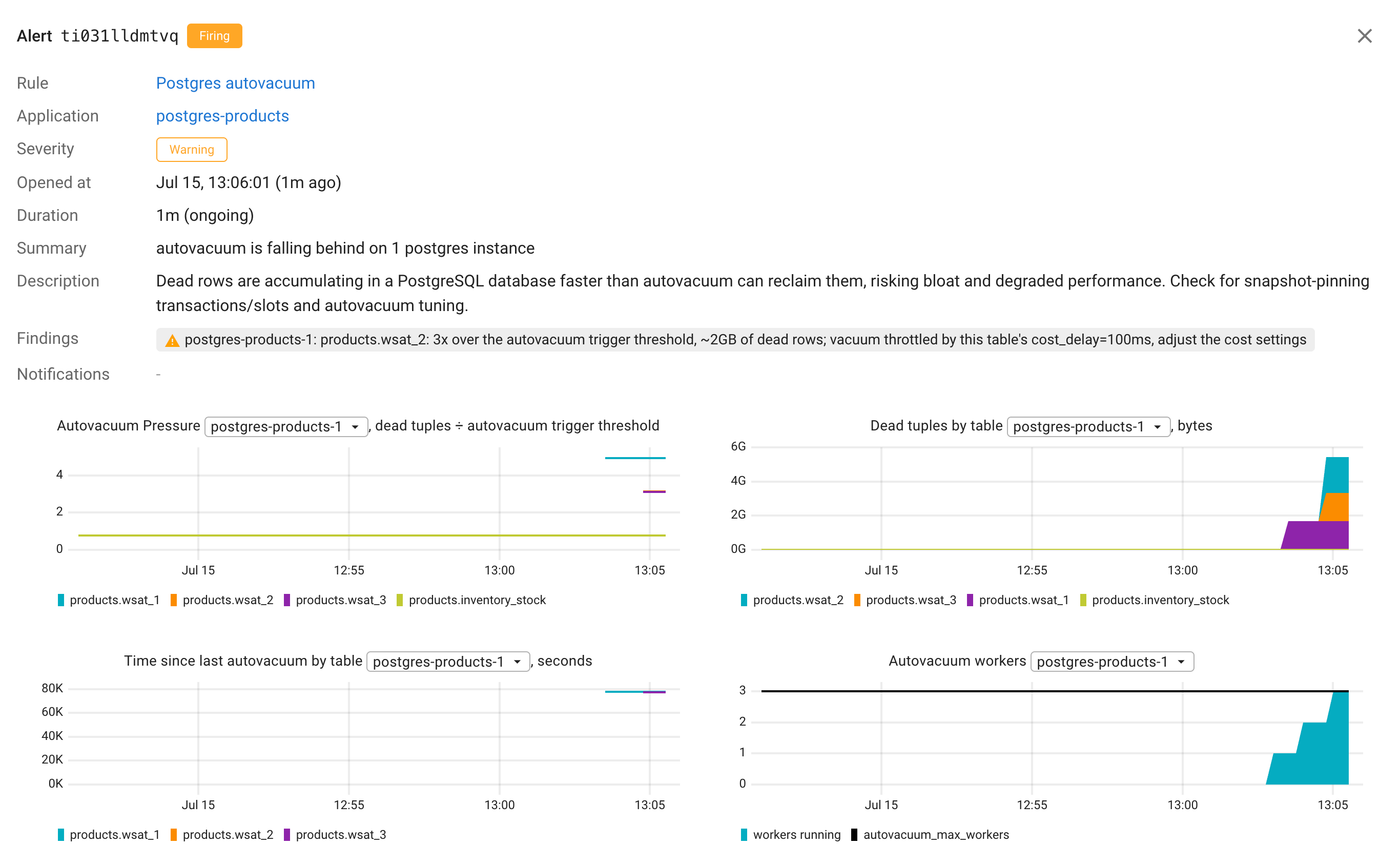
A dedicated chart makes the throttling unambiguous, showing each running vacuum parked in VacuumDelay:

Notice this is a different problem from Failure #4, even though in both cases every worker is busy. There the fix was more workers. Here more workers won't help at all, because the workers that are running are all asleep, parked in VacuumDelay. So Coroot points you at the cost settings instead of telling you to add workers. That's the difference between a finding that guesses and one that concludes.
ALTER TABLE wsat_1 RESET (autovacuum_vacuum_cost_delay); -- and wsat_2, wsat_3
Wrapping up
Autovacuum is a good example of the thesis we keep coming back to: collecting metrics is easy, collecting the telling ones is the hard part. Every dashboard graphs n_dead_tup, but almost none can tell you whether autovacuum is actually falling behind, let alone why: disabled, blocked by a stuck transaction or slot, starved for workers, or throttled to a crawl. Those cases need completely different fixes, and most have nothing to do with "tune autovacuum harder." The trick isn't a fancier collector, it's reading the system views Postgres already exposes and combining them into a signal that mirrors how Postgres itself decides.
We left out one big piece: transaction ID wraparound. Freezing is autovacuum's other job, and the same held-back holders from Failures #2 and #3 (a stuck transaction, a replication slot, a forgotten prepared transaction) are what push a database toward the wraparound limit. Coroot tracks that too, but it deserves a post of its own. That's the next one.
Want to try it on your own databases? Follow the Getting started guide for Coroot Community Edition (Apache 2.0), or try Coroot Enterprise (14-day free trial). If you like Coroot, give us a ⭐ on GitHub and say hi on Slack.