Zero-config Go heap profiling
 Nikolay Sivko
Coroot's node-agent already collects CPU profiles for any process on the node using eBPF, with zero integration from the application side. For Java, we dynamically inject async-profiler into the JVM to get memory and lock profiles. But Go processes were still a blind spot for non-CPU profiling unless the app exposed a pprof endpoint and the cluster-agent scraped it.
We wanted the same zero-config experience for Go heap profiles. This post is about how we got there.
The runtime already profiles
Go's runtime has a built-in memory profiler. On every allocation, the runtime samples with probability size / MemProfileRate and records the call stack. The default rate is 512 * 1024, or about 1 sample per 512KB allocated. Samples are aggregated into a linked list of "buckets", where each bucket represents a unique (stack trace, size class) combination and accumulates four counters: total allocations, total frees, bytes allocated, bytes freed.
This is what runtime.MemProfile() returns and what go tool pprof http://.../debug/pprof/heap renders. The overhead is negligible and it's been production-grade since forever.
There's one catch. The Go linker has an optimization: if no code in the binary references runtime.MemProfile, it sets an internal disableMemoryProfiling flag, and the runtime sets MemProfileRate = 0 on init. No samples, no buckets, nothing to read. A binary that doesn't import runtime/pprof or net/http/pprof (directly or transitively) has no heap profile available, even though the runtime fully supports it. We'll come back to this.
This list is what runtime.MemProfile() walks when pprof asks for a heap profile. It's literally the global variable runtime.mbuckets:
// runtime/mprof.go
var (
    mbuckets atomic.UnsafePointer // *bucket, memory profile buckets
    ...
)
So the data is already there, being collected continuously, for free. The only question is how to read it from outside the process.
Reading process memory from outside
Linux exposes every process's virtual address space via /proc/<pid>/mem. With the right permissions (our node-agent already has CAP_SYS_PTRACE), you can pread() arbitrary addresses. It's read-only, it doesn't suspend the process, the target doesn't even know you're there.
The plan:
- Find the virtual address of
runtime.mbucketsin the Go binary's symbol table. - Read the pointer value at that address from
/proc/<pid>/mem. - Walk the linked list, reading each bucket's header, stack PCs, and memRecord.
- Convert to pprof format and upload.
Finding runtime.mbuckets without loading the symbol table
The first gotcha: Go binaries embed their own symbol table (pclntab) for runtime use, but runtime.mbuckets is not a function. It's a variable, which lives in the ELF .symtab section. On a stripped binary (go build -ldflags="-s"), there's no .symtab and we can't find the symbol. We skip those.
On an unstripped binary, .symtab can be huge. For k3s, it's ~11MB. Using debug/elf.File.Symbols() loads all of it into memory at once. For a node-agent that profiles dozens of Go processes, that's not OK.
So we wrote a streaming scan that reads one Elf64_Sym entry at a time and reads only the bytes we need from the string table:
func findSymbolValue(ef *elf.File, sectionName, symName string) (uint64, error) {
    section := ef.Section(sectionName)
    strtab := ef.Sections[section.Link]

    symReader := section.Open()
    entry := make([]byte, 24) // Elf64_Sym
    target := []byte(symName)
    nameBuf := make([]byte, len(target)+1)

    for {
        if _, err := symReader.Read(entry); err != nil {
            break
        }
        nameIdx := ef.ByteOrder.Uint32(entry[0:4])
        value := ef.ByteOrder.Uint64(entry[8:16])

        n, _ := strtab.ReadAt(nameBuf, int64(nameIdx))
        if n > len(target) && nameBuf[len(target)] != 0 {
            continue
        }
        if string(nameBuf[:len(target)]) == symName {
            return value, nil
        }
    }
    return 0, fmt.Errorf("%s not found", symName)
}
Peak memory: a 24-byte buffer plus a 17-byte buffer (len("runtime.mbuckets")+1), regardless of binary size.
Before doing this expensive scan we also check if the binary is Go at all via the .go.buildinfo section: one section header lookup, zero allocations.
The bucket layout, and two traps
The bucket struct itself is just a 48-byte header:
type bucket struct {
    _       sys.NotInHeap
    next    *bucket
    allnext *bucket
    typ     bucketType
    hash    uintptr
    size    uintptr
    nstk    uintptr
}
But the runtime allocates extra space after it and stores two more things in the same contiguous region: the stack trace (nstk program counter addresses, 8 bytes each) and a memRecord struct holding the alloc/free counters.
So from our point of view, each bucket is a variable-sized blob: 48 bytes header + nstk*8 bytes of PCs + 128 bytes of memRecord. We read the header first to get nstk, then the rest.
Two traps we fell into:
Trap 1: the first field, _ sys.NotInHeap, looks like 8 bytes of padding. It's zero bytes. Sizing the header at 56 bytes gave us nicely parsed garbage: valid-looking pointers that turned out to be hash values, and typ values in the quintillions. Go 1.17 through 1.19 used a //go:notinheap comment directive instead; Go 1.20 switched to the typed marker, but the binary layout didn't change. The real header is 48 bytes.
Trap 2: there are two pointer fields, next and allnext. They are not the same list. next is the hash table chain within a size class. allnext is the global list of all memProfile buckets. We want allnext.
The delta problem
The counters in memRecord are cumulative: they grow monotonically over the lifetime of the process. If we want an allocation rate, we need to compute the delta between two collection cycles.
We keep a map per PID of bucket address -> previous counters and subtract on each cycle to get the delta. We key by bucket address rather than stack hash: the Go runtime never frees mprof buckets, so the address is a stable unique identifier, and it's a single uint64 instead of a variable-length string, which avoids a huge amount of allocation churn in the hot path.
Too many syscalls
Early profiles showed our collector spending 30-40% of its CPU in syscall.Pread. Each bucket needs at least 2 reads: one for the header (to get nstk), then one for the variable-length stk[nstk] | memRecord block. With 1000+ buckets per process and a dozen Go processes on a node, that's thousands of syscalls per minute.
We tried a read-ahead cache: on a miss, pull 256KB centered around the requested address. The idea was that Go's persistentalloc places buckets in large arenas, so consecutive buckets in the allnext chain might be physically close.
We instrumented jump distances between consecutive buckets for one process with 1230 buckets:
| Jump distance | Count | % |
|---|---|---|
| < 1KB | 161 | 13% |
| < 64KB | 1 | 0% |
| < 256KB | 80 | 7% |
| < 1MB | 244 | 20% |
| < 16MB | 246 | 20% |
| >= 16MB | 497 | 40% |
40% of jumps are >16MB. Buckets are scattered across the entire process address space, not clustered. A 256KB cache hits ~20% of the time: better than nothing, but the best we could do without multi-MB buffers that cost more than they save.
The linker-disabled profiling problem
After deploying, we saw some Go processes return an empty bucket list (runtime.mbuckets pointer was 0x0) even though they were clearly allocating memory (tens of MB RSS, actively running).
Turns out the Go linker has an optimization: if no code in the binary references runtime.MemProfile, it sets a disableMemoryProfiling flag, and the runtime sets MemProfileRate = 0 on init. No profilealloc() calls, no buckets ever created.
This hits any Go binary that doesn't import runtime/pprof or net/http/pprof, directly or transitively. In our case it was a small load generator: no pprof, no HTTP server, no dependencies that would drag pprof in. The profile endpoint the runtime would serve is dead code, so the linker dropped it.
The fix: we can write to /proc/<pid>/mem too. If we detect MemProfileRate == 0, we write 524288 (the default) back to the runtime.MemProfileRate address. The runtime checks this variable on every allocation, so the change takes effect immediately: no restart, no signal, nothing. Just a single atomic 8-byte write to a known address in the data segment.
This is gated behind a --go-heap-profiler=force flag for users who want the "always on" behavior:
--go-heap-profiler=disabled  # off
--go-heap-profiler=enabled   # default, passive only
--go-heap-profiler=force     # write MemProfileRate if zero
The overhead of re-enabling profiling is whatever the Go default overhead is: ~1 sample per 512KB. For any workload where this matters, you'd want it on anyway.
Allocation rate metrics
Since we already compute per-bucket alloc deltas, exposing total allocation rate as Prometheus counters is free:
container_go_alloc_bytes_total    # total bytes allocated
container_go_alloc_objects_total  # total objects allocated
Summed across all buckets in the process. Coroot uses them to draw the allocation rate chart alongside the flamegraph.
Limitations
- Stripped binaries are skipped. No
.symtab, noruntime.mbucketsaddress, nothing we can do externally. - The
activecycle updates on GC. Between GCs, new allocations go intofuture[0..2]and we don't see them. Same limitation asruntime.MemProfile(). - Go-internal struct layout. If the
bucketstruct changes in a future Go release, we'll need to update. The layout has been stable since Go 1.17, but there's no API guarantee. - Goroutine, block, and mutex profiles are not yet exposed. Block and mutex use the same infrastructure (
bbuckets,xbuckets), but both are disabled by default and have real overhead if enabled (checks on every mutex/channel op), so we're not force-enabling them.
In Coroot
Profiles are already in the Coroot UI. Every memory chart has a link to the heap flamegraph for that service, so you can jump from "memory is climbing" to "here's the call stack eating it" in one click.
What's new is that profiles are now plugged into RCA. If Coroot sees a service's CPU or memory go up at the same time as an issue, it pulls up the profile and compares two windows: the one during the issue, and a healthy one from just before. The flamegraph you see in the RCA is a diff, not a snapshot. Functions that got hotter pop out, the rest fade away.
So now RCA can give you a different kind of answer. Instead of "p95 is up, allocations are up", you get "this function is allocating twice as much as it was before the deploy." The metric tells you something is off. The diff tells you which code is off.
Chaos experiments
To see this in action, we set up a small demo and broke it on purpose. There's a product-catalog service backed by Postgres, sitting behind an api-gateway. We bolted a chaos middleware onto product-catalog so we can flip on different kinds of bad behavior with a single API call, then we watched what showed up in Coroot.
GC pressure
For the first experiment, we flipped on the gc_pressure switch. That sends every request through a function called inefficientEnrichProducts, which is exactly as bad as the name suggests. For each of 30 fake products in the request, it:
- Marshals and unmarshals the product 10 times in a row.
- Builds a "search index" by lowercasing, uppercasing and title-casing every word and generating every 2 to 4 character n-grams.
- Builds 20 nested "related products" maps, each with three sub-maps.
- Marshals and unmarshals the whole result one more time "for caching".
That's about 2 MB of throwaway memory per request. The service still answers, but the garbage collector barely gets a break.
The pain shows up one hop away. api-gateway talks to product-catalog on every page render, so as soon as the switch flips, its p95 latency jumps from 0.16s to 3.76s:
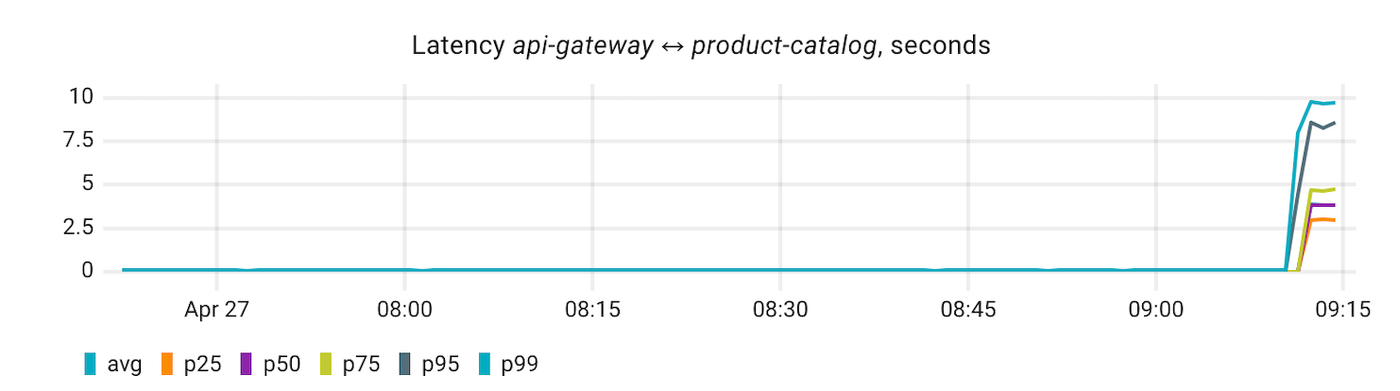
Coroot's RCA traces the spike back to product-catalog and pulls up its CPU profile:
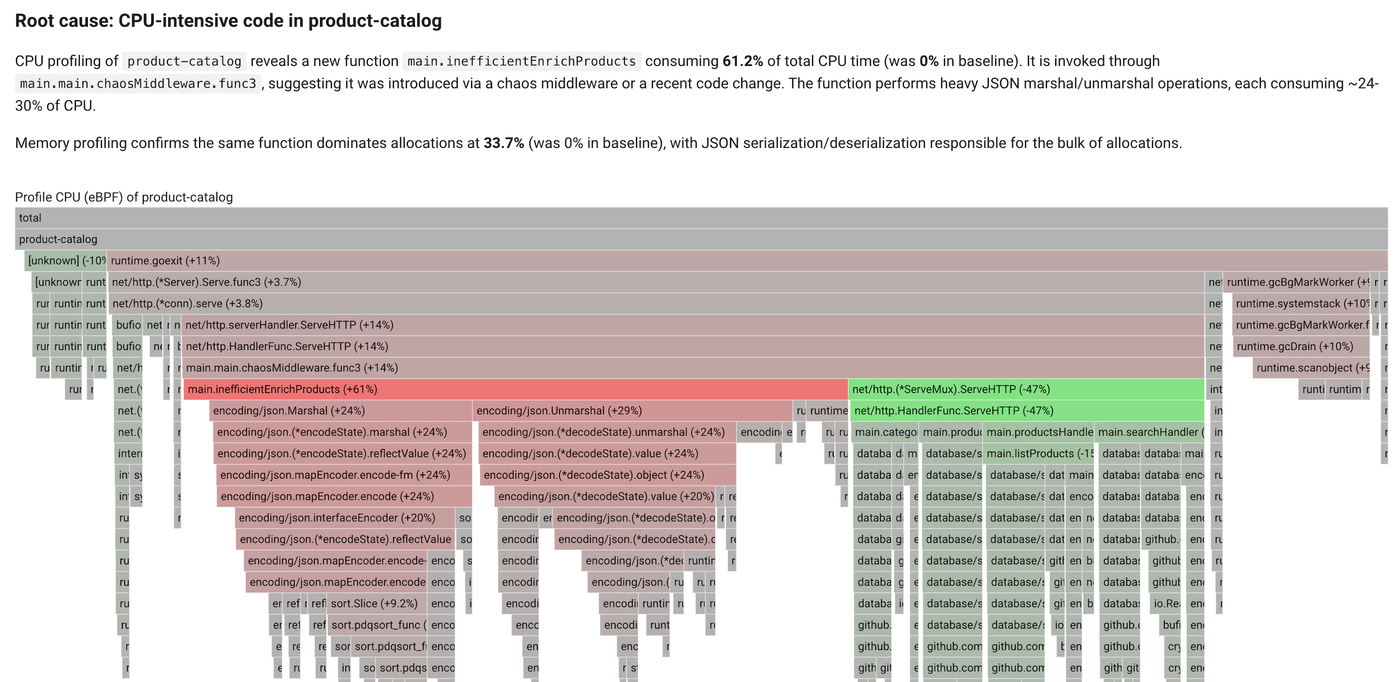
Look at the right side of the flamegraph. There's a fat column of runtime.gcBgMarkWorker, runtime.systemstack, runtime.scanobject, runtime.gcDrain. The garbage collector is burning real CPU. That's a clear sign the runtime is under allocation pressure, but the CPU profile can't tell you which line of your code is responsible for it.
The heap profile can:
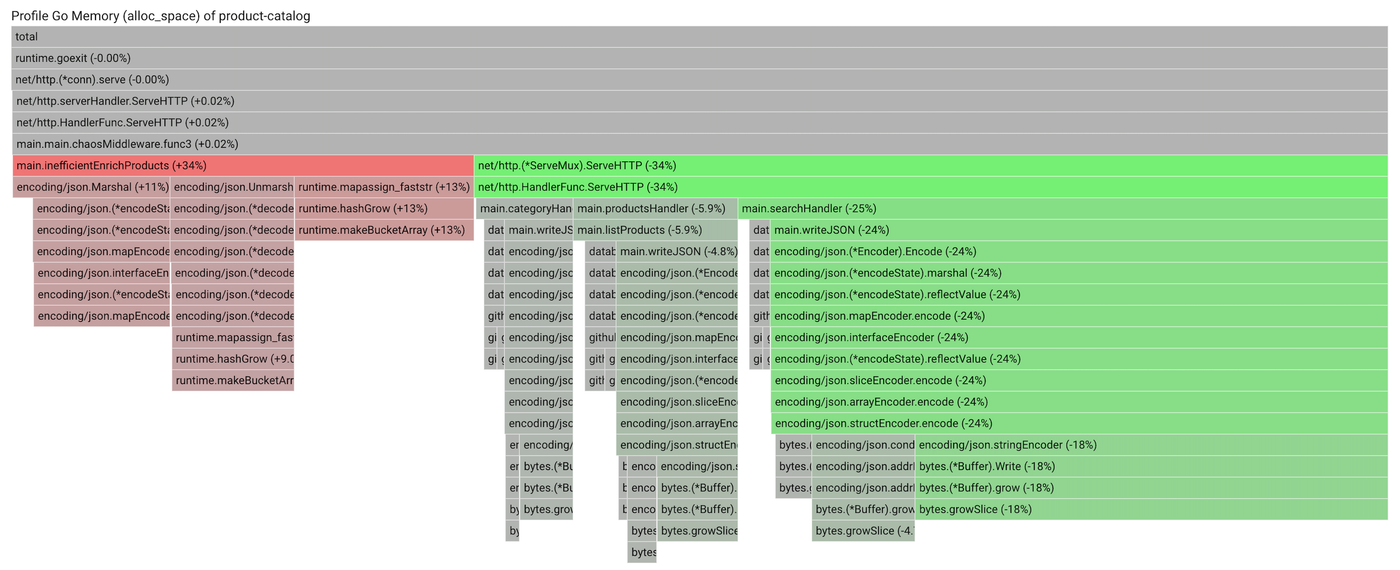
There it is. main.inefficientEnrichProducts sits at the top of alloc_space, with the JSON encoders, map growth, and bytes.Buffer operations stacked underneath. That's the exact set of things the function does inside its loop. Same function the CPU profile already flagged, but now you can see directly that it's the one driving the GC.
Without the heap profile, you'd see the GC running hot and the JSON encoder eating CPU, and you'd still have to guess which call site to fix. With it, the guess is gone. Cache the marshalled output, drop the redundant rounds, or both, and the alloc band and the GC band shrink together on the next collection.
Memory leak
For the second experiment, we flipped the memory_leak switch. Now every request calls appendToProductCache, which builds a small chunk of pointer-heavy data (a product map, a search index of fifty terms, cross-references to recent entries) and appends it to a global slice. Nothing ever evicts. The cache grows about 200 KB per request, forever.
The symptom is the obvious one. product-catalog memory just keeps climbing. After a few minutes, both replicas are growing at over 640% per hour and on track to OOM-kill themselves.
What's interesting is what RCA does next. It pulls up the heap profile for the anomaly window and compares it against a healthy window from before the leak started:
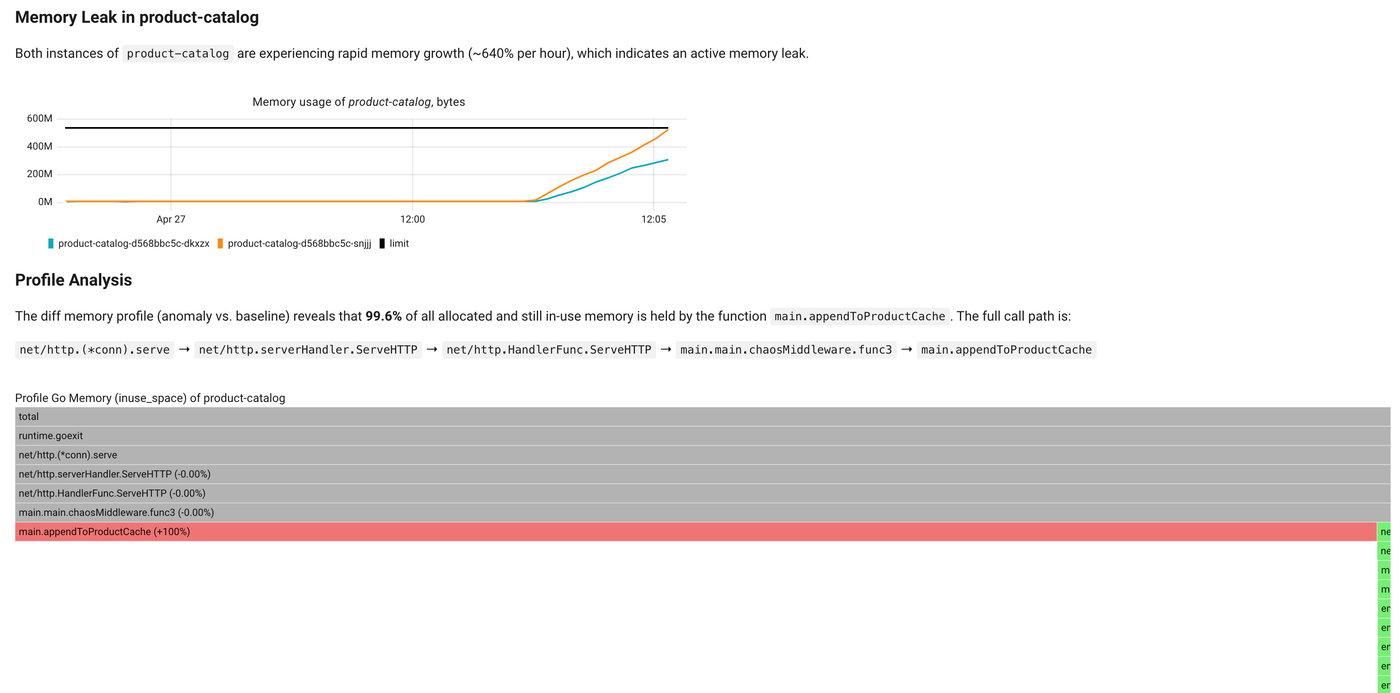
The diff narrows it down to a single function. main.appendToProductCache accounts for 99.6% of the in-use memory that wasn't there before, and the full call path from the HTTP entrypoint down to it sits right above the flamegraph. There's almost nothing left to investigate.
A plain heap snapshot would have shown appendToProductCache near the top too, but mixed in with everything else the service legitimately allocates. The diff drops the noise and keeps only what changed, which is exactly what you want when you're chasing a leak that started somewhere in the last hour.
Summary
Heap profiles for your Go services no longer require pprof endpoints, scraping configuration, or a deploy. Coroot picks them up automatically from whatever is already running on your nodes, with no code changes, no annotations, and no restart.
The payoff shows up in incidents. A memory leak comes down to one function in a diff'd flamegraph. GC pressure stops being a vague "the runtime is busy" and becomes a specific call site. And you get this code-level accuracy without needing access to the code itself, which matters for SRE and platform teams running services they didn't write. Because the profiles sit right next to the metrics and the RCA that surfaced the issue, you go from "something is wrong" to "here is what to fix" without ever leaving the page.
Zero-config Go heap profiling is available in both Coroot Community and Enterprise Edition. Check the documentation, give us a ⭐ on GitHub if you find it useful, and join the conversation on Slack.