
Comprehensive Postgres observability: is your database healthy, and will it stay that way?
 Nikolay Sivko
A Postgres database is one of the most complex pieces of software you run. It stores your data durably so a power loss doesn't lose a committed transaction. It hands out real transactions while thousands of queries fight over the same rows. It stays available when a node dies, lets you rewind to a point in time after someone drops the wrong table, and constantly tunes itself with background jobs. Two questions matter about all of that machinery: is it healthy right now, and will it stay healthy? The second one is the hard part, because the things that quietly rot a database almost never show up until they're an outage.
That complexity is why the DBA exists, the person who watches replication and backups and the query planner and knows what to do when one of them drifts. But most teams don't have one. So the real question is how you answer both of those questions, healthy now and staying healthy, without a specialist watching the database full time. That's what we've been building for Postgres in Coroot, our open-source observability platform.
The problems that don't page you
For most teams the database is just "the thing the backend talks to," owned by whoever happens to be on call. That works right up until it doesn't. A replica silently stops streaming. A scheduled backup quietly hasn't run in two days. Autovacuum falls behind and queries start getting slower for no reason anyone can point to.
None of these page you, because nothing has crashed. The database is up. It's just wrong in a way only someone who understands databases would catch. That's the trap with database problems: they rarely announce themselves. They show up later as a slow endpoint, a disk that fills up overnight, or a failover that promotes a replica that turns out to be hours stale.
"But we're on RDS"
The usual answer is a managed database. RDS, Aurora, Cloud SQL. And they genuinely help. They take a good chunk of the operational work off your hands: provisioning, patching, hardware, automated snapshots, failover to a standby. That's real work, and it's nice to skip it.
But that's the infrastructure half of running a database, not the whole job. A managed database will still happily let you accumulate 200 GB of bloat, run a replica that's hours behind, or exhaust your connection pool. It hands you a wall of CPU and IOPS graphs, which is not the same thing as "your backup schedule stopped running last night" or "this table is 4x past the point where autovacuum should have cleaned it up, and a replication slot is what's blocking it." The managed part is the infrastructure. The database itself is still yours to understand.
The real gap is knowledge, not tooling
The hard part of running Postgres well was never running the commands. It was knowing which numbers matter, and what they mean together.
The number of dead rows going up isn't a problem. The number of dead rows going up while the table was vacuumed 30 seconds ago is a problem, and it usually means something is holding the vacuum horizon. A backup job that reports success isn't reassuring either if WAL archiving has been broken for a day, because your recovery window is now a day wide.
The signal is almost never a single metric. It's one metric read in the context of three others, the way a DBA reads it. That's the part you can't get by adding another dashboard, and it's exactly the part we tried to put into Coroot.
The checks a DBA would run
So instead of shipping more graphs, Coroot runs the checks a DBA would run, on its own, and tells you the conclusion. It reads the same system views a DBA would open by hand (pg_stat_activity, pg_stat_progress_vacuum, pg_replication_slots, pg_stat_archiver, and friends), combines them, and turns each one into a plain finding that names the object, the cause, and the fix.
A few examples, one per thing a database has to get right.
Backups you can actually recover from
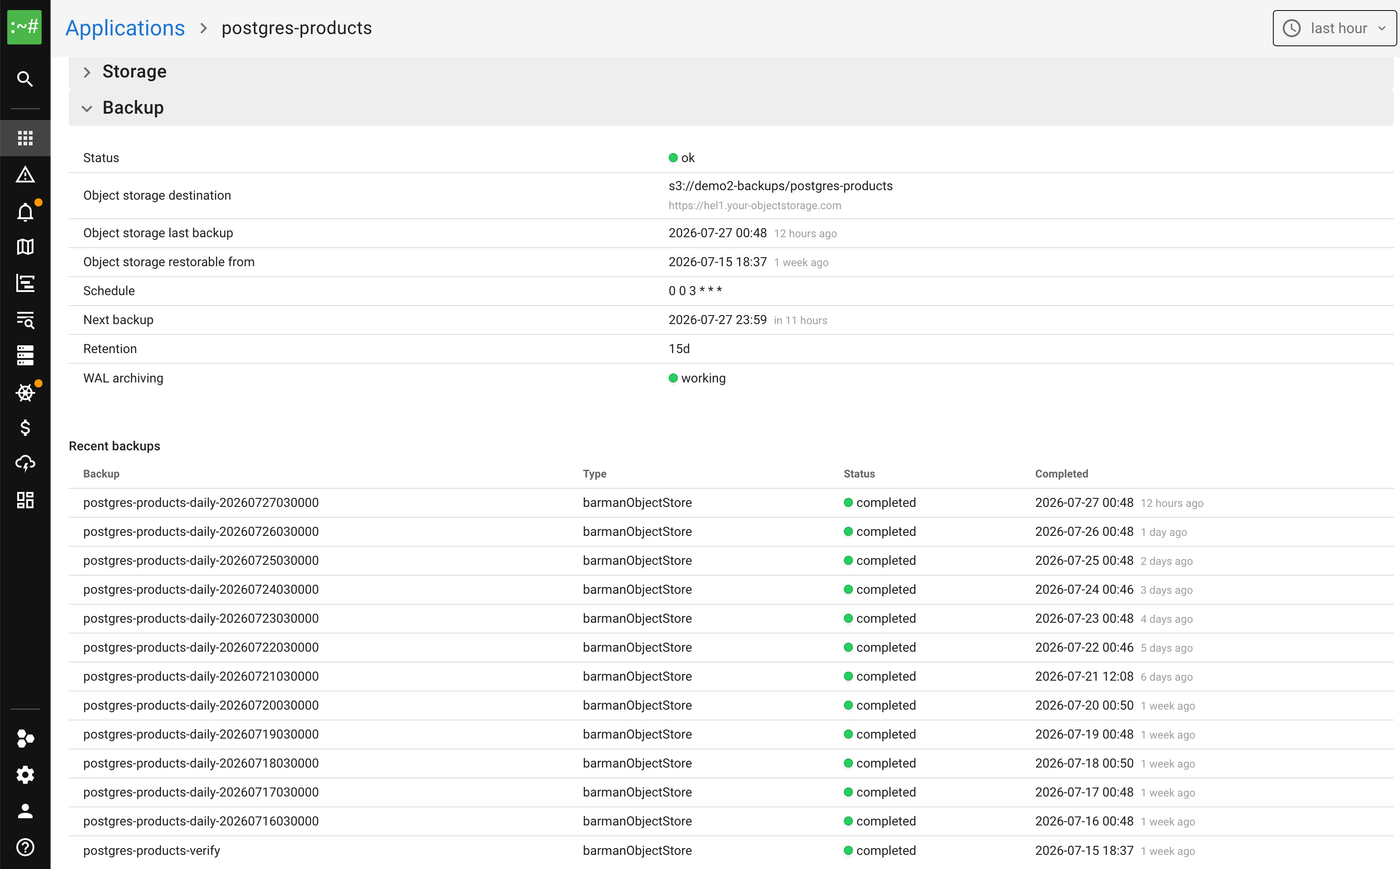
"We have backups" is a belief until you've restored one. Coroot doesn't just check that a backup ran. It knows your schedule, so it flags an overdue backup even when the operator still shows a cheerful future "next backup" time. It checks WAL archiving, because a base backup with broken archiving quietly narrows your recovery window to nothing. And when a backup fails, it hands you the operator's reason in plain language instead of a status code to go decode.
Replicas that are actually replicating
A replica is only a failover target if it's caught up. Coroot splits replication lag into shipping (WAL the replica hasn't received yet) and apply (received but not yet replayed), so you can tell a slow network apart from a replica stuck behind a long-running query. And it catches the dangerous case that's easy to miss: the replica isn't a little behind, it's disconnected. The WAL receiver is down and the lag is growing without bound.
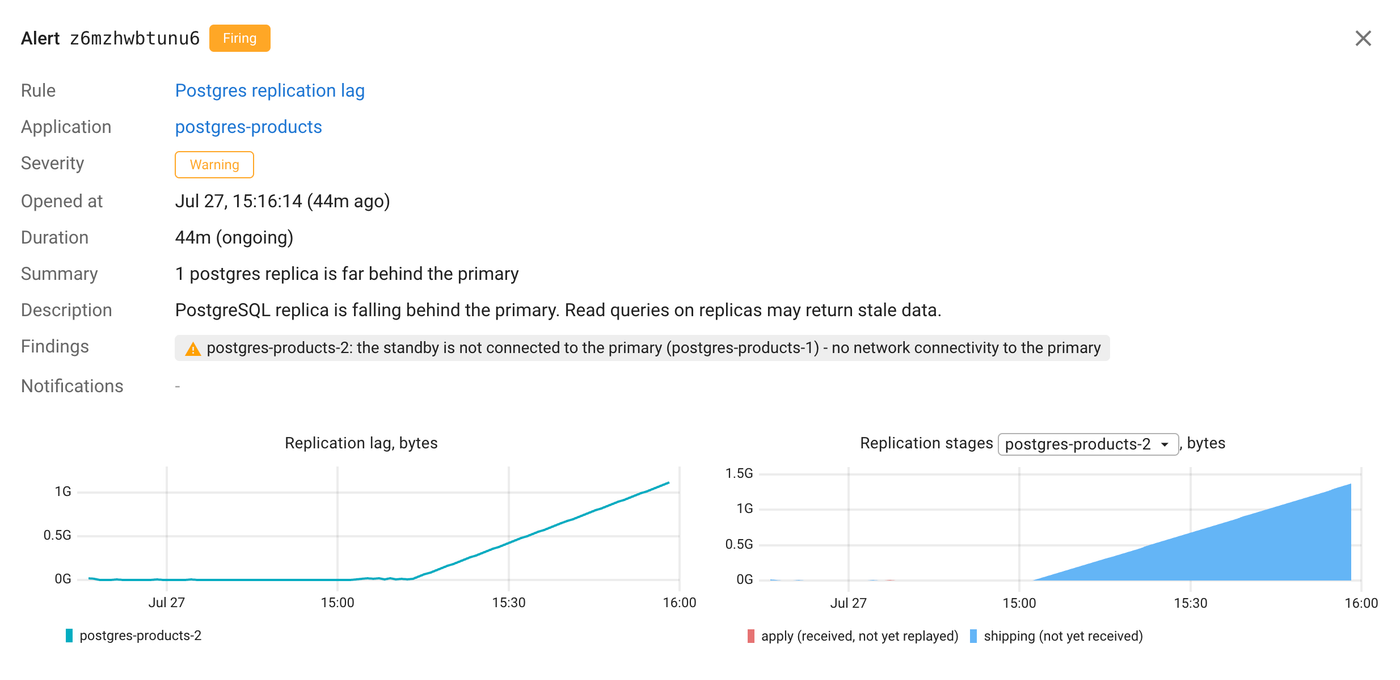
That case is trickier than it sounds. When we tried to reproduce it on our demo, the replica stubbornly refused to fall behind, because a CloudNativePG standby quietly restores WAL from object storage when streaming is cut. We wrote up the whole rabbit hole in It was surprisingly hard to break CloudNativePG replication.
The quiet maintenance
This is the stuff with no user-facing symptom until it's an outage: autovacuum falling behind, tables bloating, transaction IDs creeping toward wraparound. Coroot measures autovacuum as pressure, how far past its own trigger point a table has drifted, rather than a raw dead-row count that swings up and down by design. And when a table is behind, it tells you why: autovacuum disabled on the table, a stuck transaction or a replication slot holding the vacuum horizon, every worker busy, or a vacuum that's running but throttled to a crawl by its cost settings.
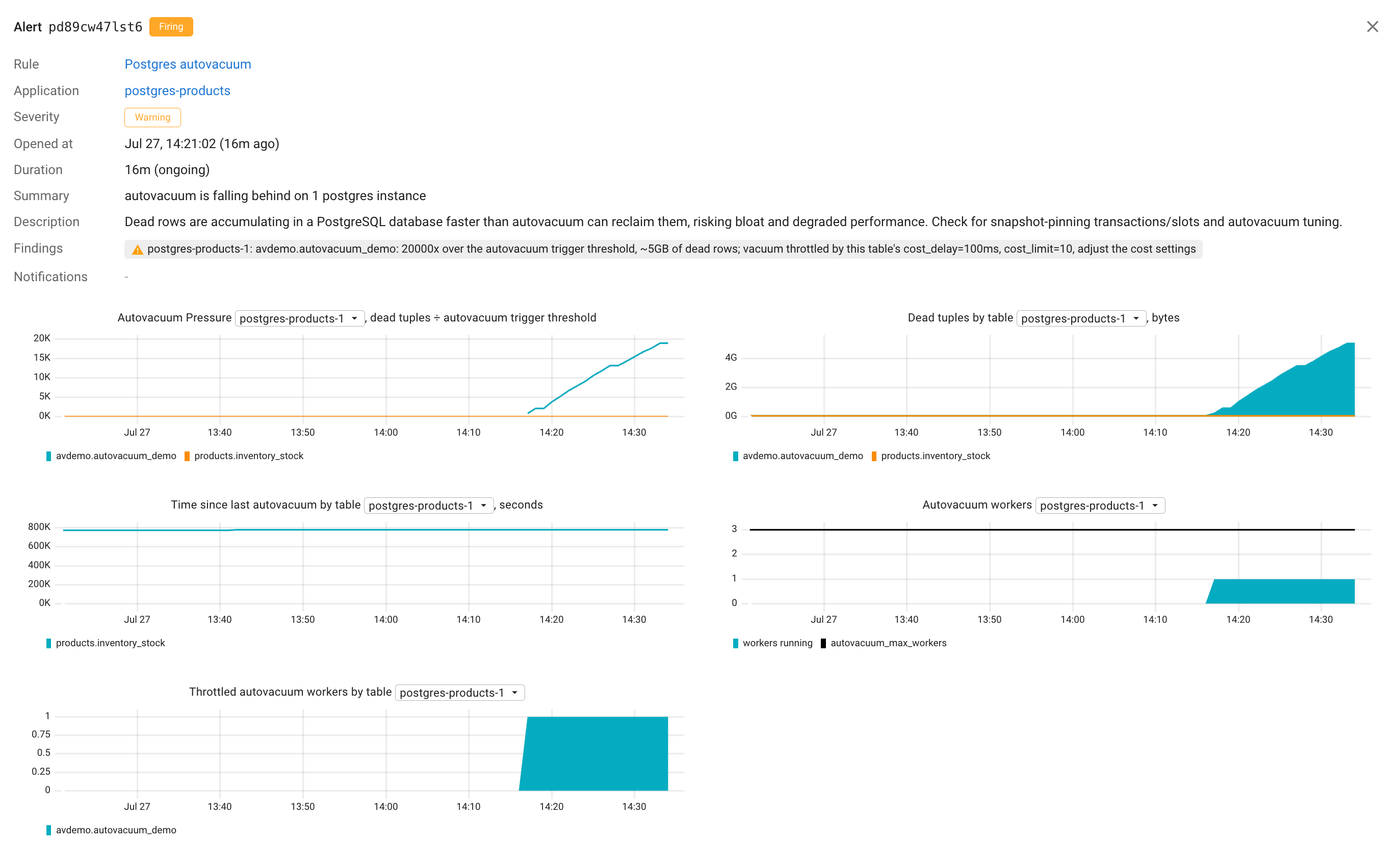
Those causes have completely different fixes, and most have nothing to do with "tune autovacuum harder." A finding that says "autovacuum is behind" sends you digging. A finding that says "throttled by this table's cost_delay=100ms, adjust the cost settings" sends you straight to the fix.
And the rest of the checklist is there too: WAL archiving failures, checkpoints falling behind, stale planner statistics, table and index bloat, connection saturation, and WAL and storage growth.
It understands your operator, too
If you run Postgres on Kubernetes, you probably run it through an operator. Coroot understands the major ones (CloudNativePG, the Percona Operator, Zalando, StackGres). It detects cluster topology and primary/replica roles automatically, and reads backup state straight from their custom resources. So the backup and replication findings work the same whether your Postgres is a managed cloud instance, a plain StatefulSet, or an operator-managed cluster.
The database is only half the picture
A database never breaks in isolation. A slow query is a slow endpoint. A lagging replica is a network problem. A disk filling up is infrastructure. A tool that only watches the database leaves you with the symptom in one place and the cause in another.
That's why Coroot isn't a database add-on but a full-stack platform. The same eBPF that reads Postgres queries on the wire also maps every service call, node, and container, and pulls in logs, traces, and profiling, all with nothing to instrument. So a Postgres finding shows up right next to the app it's slowing and the machine it runs on.
Wrapping up
None of these checks are new. They're the things a careful DBA already watches: overdue backups, a disconnected replica, autovacuum falling behind, bloat, transaction ID wraparound. Coroot runs all of them for you, automatically and continuously, and turns each one into a plain finding with the cause and the fix. Database best practices, automated, so the slow failures get caught long before they turn into outages.
Want your own databases fully observable? Follow the Getting started guide for Coroot Community Edition (Apache 2.0), or try Coroot Enterprise (14-day free trial). If you like Coroot, give us a ⭐ on GitHub and say hi on Slack.