
It was surprisingly hard to break CloudNativePG replication
 Nikolay Sivko
I wanted a Postgres replica that falls behind its primary. Sounds easy. It wasn't. Every time I cut the replica off from the primary, its lag jumped for a moment and then dropped right back to zero. It just would not stay behind. Chasing down why turned into a fun little tour of how a Postgres standby keeps itself alive, and what CloudNativePG quietly sets up behind the scenes.
Some background. We build Coroot, an observability platform: eBPF metrics, logs, traces, profiling, and automated root-cause analysis on top. Lately we've been making its Postgres support a lot deeper. When we add a new check, we don't just trust that it works. We break a real database and watch what the tool says. This time I wanted the most basic failure there is, a replica that can't keep up with its primary. So I grabbed Chaos Mesh and cut the network between the two. That's where it got weird.
The setup
The demo runs a CloudNativePG cluster with two instances. The part of the spec that matters here is that it has backups configured to object storage:
apiVersion: postgresql.cnpg.io/v1
kind: Cluster
metadata:
  name: postgres-products
spec:
  instances: 2
  storage:
    size: 250Gi
  backup:
    retentionPolicy: "15d"
    barmanObjectStore:
      destinationPath: s3://demo2-backups/postgres-products
      endpointURL: https://hel1.your-objectstorage.com
      wal:
        compression: gzip
Two instances means one primary (postgres-products-1) and one replica (postgres-products-2). The barmanObjectStore block turns on continuous WAL archiving: the primary compresses and ships every completed WAL segment to a Hetzner S3 bucket. Hold on to that, because it's the whole story.
To generate a steady stream of real WAL, I run a small workload that inserts into an ordinary table on the primary, about a thousand rows a second:
CREATE TABLE events (
    id         bigserial PRIMARY KEY,
    created_at timestamptz NOT NULL DEFAULT now(),
    kind       text NOT NULL,
    payload    text NOT NULL
);

-- looped once a second
INSERT INTO events (kind, payload)
SELECT (ARRAY['order','click','view','signup'])[1 + floor(random() * 4)],
       repeat(md5(random()::text), 32)
FROM generate_series(1, 1000);
That's roughly 1 MB/s of WAL, so a 16 MB segment fills and gets archived every fifteen seconds or so. Nothing exotic, just a table taking writes.
Attempt 1: fence the replica from the primary
The plan is a NetworkChaos that partitions the replica from the primary in both directions and touches nothing else. The replica can still reach everything else (Coroot's collector, the object store), it just can't talk to the primary:
apiVersion: chaos-mesh.org/v1alpha1
kind: NetworkChaos
metadata:
  name: fence-postgres-replica
spec:
  action: partition
  mode: all
  direction: both
  selector:
    labelSelectors: { cnpg.io/cluster: postgres-products, role: replica }
  target:
    mode: all
    selector:
      labelSelectors: { cnpg.io/cluster: postgres-products, role: primary }
Primary taking a thousand inserts a second, replica cut off from it. The lag should climb and never stop. Instead, this is what Coroot showed:

A sawtooth. On the left, "Replication lag" climbs to about one WAL segment, 16 to 19 MB, then drops back toward zero, over and over. The replica is cut off from its primary, the primary is writing continuously, and yet it keeps catching back up.
And it gets stranger, because the two charts tell opposite stories. The left one says the replica is basically keeping up. But on the right, "Replication stages" shows the shipping component climbing in a straight line past 400 MB and still going, which says it's falling hopelessly behind. Both are reading from the same replica at the same time.
Where is the WAL coming from?
The two charts come from two different Postgres pointers, so let's look at them directly on the replica. First, is there even a streaming connection?
SELECT * FROM pg_stat_wal_receiver;

(0 rows)
None. No WAL receiver process at all, streaming is dead. Now the two pointers. In psql, \watch reruns a query on an interval, so we can watch them move over a few seconds:
SELECT pg_last_wal_receive_lsn() AS receive,
       pg_last_wal_replay_lsn()  AS replay \watch 5

    receive    |    replay
---------------+---------------
 196/73863110  | 196/A0FFFCE8

    receive    |    replay
---------------+---------------
 196/73863110  | 196/A1FFFFA8

    receive    |    replay
---------------+---------------
 196/73863110  | 196/A2FFFF08
There it is. pg_last_wal_receive_lsn(), the last WAL location received over streaming, is frozen solid, which fits, since there's no receiver. But pg_last_wal_replay_lsn(), the last WAL location the replica has actually replayed, keeps advancing. In fact replay is running about 760 MB ahead of receive, and the gap is growing. The replica is replaying WAL it never received over streaming, which is only possible if the WAL is coming from somewhere else.
The replica's logs say exactly where. The WAL receiver is stuck failing to connect:
FATAL: streaming replication receiver "postgres-products" could not connect to the primary server: connection to server at "postgres-products-rw" (10.43.15.136), port 5432 failed: Connection timed out
and interleaved with those failures, the startup process is happily replaying restored segments:
LOG: restored log file "00000003000001960000008A" from archive
In one slice of the log I counted 45 connection timeouts and 48 restored-from-archive lines. So the replica has a restore_command, and Postgres tells us what it is:
SHOW restore_command;

/controller/manager wal-restore --log-destination /controller/log/postgres.json %f %p
That's CloudNativePG's own binary. And one more log line spells out precisely where it fetches from:
wal-restore: WAL file not found in the recovery object store, walName "00000003000001960000008C", options ["--endpoint-url","https://hel1.your-objectstorage.com","--cloud-provider","aws-s3","s3://demo2-backups/postgres-products", ...]
That is our backup bucket. The replica is pulling WAL from the same S3 the primary archives to. Which finally explains the two charts. receive_lsn only moves when WAL arrives over streaming, so with streaming fenced it's frozen, and "shipping" (primary_lsn - receive_lsn) climbs forever. replay_lsn moves whenever WAL is replayed from any source, and the archive keeps feeding it, so "replication lag" (primary_lsn - replay_lsn) stays within a segment. The sawtooth is the archive cadence: the replica catches up to the last archived segment, waits for the primary to fill and ship the next one, catches up again.
The real answer is in Postgres, not CloudNativePG
It's tempting to call this a CloudNativePG behavior, but the fallback itself is pure PostgreSQL. A standby in recovery reads WAL through a small state machine that walks the available sources, and it's spelled out in a comment in src/backend/access/transam/xlogrecovery.c (Postgres 18, the version on the demo):
/*-------
 * Standby mode is implemented by a state machine:
 *
 * 1. Read from either archive or pg_wal (XLOG_FROM_ARCHIVE), or just
 *    pg_wal (XLOG_FROM_PG_WAL)
 * 2. Check for promotion trigger request
 * 3. Read from primary server via walreceiver (XLOG_FROM_STREAM)
 * 4. Rescan timelines
 * 5. Sleep wal_retrieve_retry_interval milliseconds, and loop back to 1.
 *
 * Failure to read from the current source advances the state machine to
 * the next state.
 */
The sources are an enum at the top of the same file, and notice what the archive one is:
XLOG_FROM_ARCHIVE,   /* restored using restore_command */
XLOG_FROM_PG_WAL,    /* existing file in pg_wal */
XLOG_FROM_STREAM,    /* streamed from primary */
So when streaming breaks, Postgres doesn't give up, it advances the state machine. The code for the streaming-failure case says exactly what it does next:
case XLOG_FROM_STREAM:
    /*
     * Failure while streaming. Most likely, we got here because
     * streaming replication was terminated ... we treat that the
     * same as disconnection, and retry from archive/pg_wal again.
     * The WAL in the archive should be identical to what was
     * streamed ...
     */
That's the exact loop I fenced the replica into. Streaming dies, Postgres retries from the archive, replays whatever segments are there, runs out, tries streaming again, finds it still fenced, and goes back to the archive. As long as restore_command can reach the bucket, the replica keeps replaying. This has nothing to do with CloudNativePG. It's how any Postgres standby with an archive behaves.
CloudNativePG's part: turning both sources on
All CloudNativePG does is configure both sources so the state machine has somewhere to fall back to. When the instance manager writes a replica's config, it sets primary_conninfo (source 3, streaming) and restore_command (source 1, archive) right next to each other, from pkg/management/postgres/configuration.go:
options := map[string]string{
	"restore_command": fmt.Sprintf(
		"/controller/manager wal-restore --log-destination %s/%s.json %%f %%p",
		postgres.LogPath, postgres.LogFileName),
	"recovery_target_timeline": "latest",
	"primary_conninfo":         primaryConnInfo,
}
That restore_command is CNPG's own wal-restore binary, and it's the piece that points at object storage. From internal/cmd/manager/walrestore/cmd.go it tries a WAL plugin first, then the in-tree barman-cloud support that reads from the bucket, prefetching several segments in parallel into a local spool (which is why the replica kept up so comfortably instead of trickling one segment at a time).
There's one more detail here, and it's the thing that actually shapes the sawtooth. The archive only ever holds completed segments, the ones the primary has already shipped, so the replica can drain it and then reach for a segment that isn't there yet. When wal-restore's prefetch runs into that missing segment, it exits with an error on purpose:
end-of-wal-stream flag found. Exiting with error once to let Postgres try switching to streaming replication
A failing restore_command is how Postgres knows a segment isn't in the archive yet. That failure tells it to stop reading the archive and try streaming instead. CNPG does this on purpose. It wants the replica on live streaming whenever possible, because streaming is current and the archive always trails by a segment or two. In normal operation, that's how a replica hops back onto streaming the moment it catches up.
But our replica is fenced, so the same nudge just goes in circles. Postgres tries to stream, times out, and drops back to the archive. By then the next segment has landed in the bucket, so the replica grabs it, catches up, empties the archive, and starts over. That loop is the sawtooth: catch up, wait for the next segment, catch up again.
So the split is simple. Postgres runs the "try streaming, fall back to the archive" logic. CloudNativePG just turns both sources on and provides the wal-restore that reads from S3.
Actually breaking it: cut the archive too
So a CloudNativePG replica has two ways to get WAL: stream it from the primary, or restore it from the object store. To actually strand the replica I have to close both doors. A second NetworkChaos blocks the replica from the S3 endpoint:
apiVersion: chaos-mesh.org/v1alpha1
kind: NetworkChaos
metadata:
  name: fence-replica-from-archive
spec:
  action: partition
  mode: all
  direction: to
  selector:
    labelSelectors: { cnpg.io/cluster: postgres-products, role: replica }
  externalTargets: [hel1.your-objectstorage.com]
The instant it takes effect, replay_lsn stops dead. With no WAL coming from either source, the replica's replay position freezes and the lag finally does what I wanted all along. It climbs, and keeps climbing:

Both WAL sources are gone, replay is frozen, and this is finally the failure I set out to reproduce. And now Coroot fires the replication check. Because the WAL receiver is down, it doesn't just say the replica is behind, it names the reason: the standby is not connected to the primary, and connection attempts to it are failing.
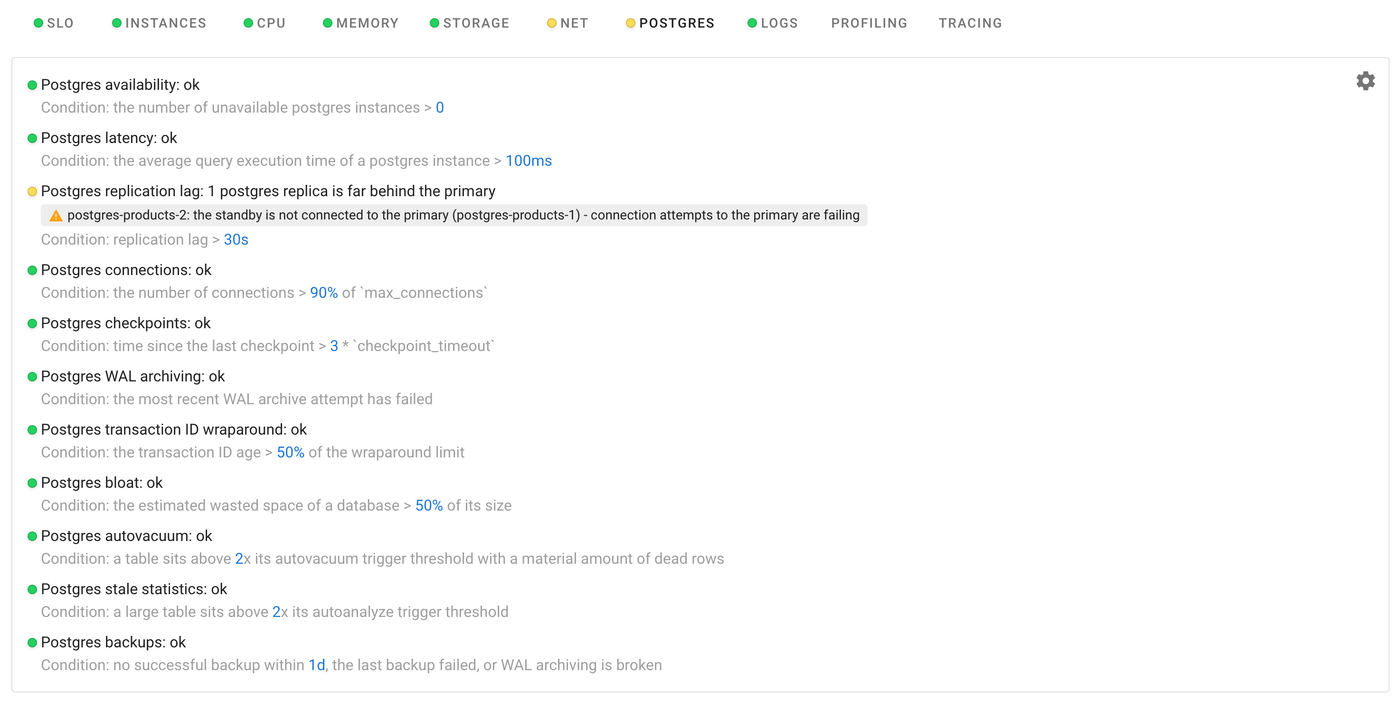
That last bit, "connection attempts to the primary are failing," doesn't come from Postgres. Coroot watches every connection with eBPF, and its network view had already spotted the replica trying and failing to reach the primary. The replication check just pulls that in, so the finding covers both sides. Postgres says the WAL receiver is down, and the network says why, the path to the primary is broken.
It took cutting off both paths to get here.
Break things on purpose
The best way to learn how something works is to break it. I thought I understood Postgres replication, but then a replica just would not fall behind, no matter what I did. Finding out why taught me more about how Postgres gets its WAL than any docs did. Break things, watch what happens, and you learn them much faster.
There's a practical reason too. If you build a tool that should warn you when something breaks, you need to break something and check that it notices. An alert that has never seen a real failure is just a guess. So we use Chaos Mesh to break our own demo on purpose. This time the check did its job. It stayed quiet while the replica was fine, and it warned us with the right reason as soon as the replica really fell behind. That's the only kind of alert I trust.
Want your own databases fully observable? Follow the Getting started guide for Coroot Community Edition (Apache 2.0), or try Coroot Enterprise (14-day free trial). If you like Coroot, give us a ⭐ on GitHub and say hi on Slack.