Coroot at KCD Argentina
 Alexander Lamberton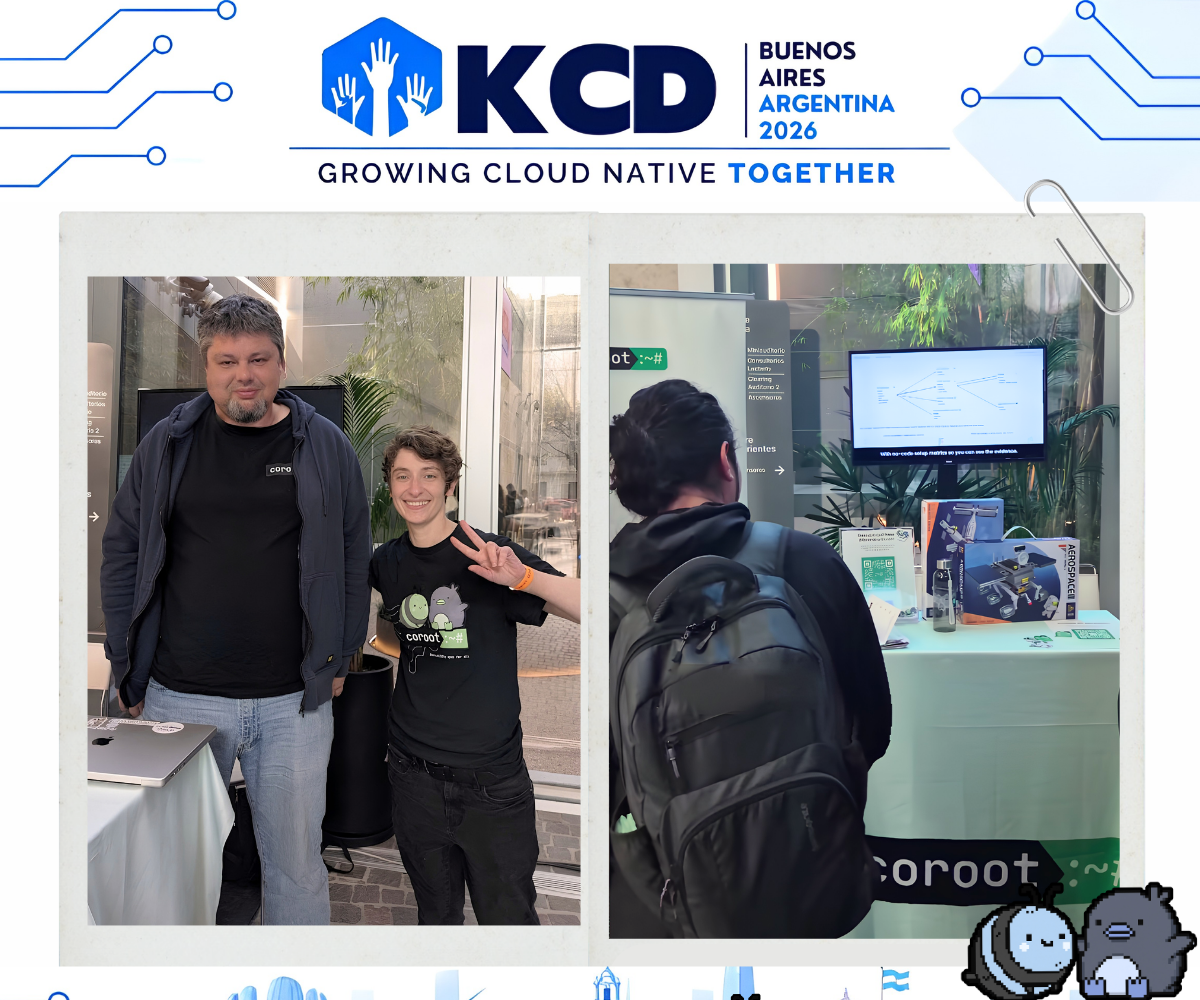
Kubernetes Community Days (KCD) Argentina brought together the vibrant technology communities of Buenos Aires for in-depth technical talks, SRE workshops, and an amazing opportunity to connect with fellow experts in cloud technology.
Coroot had a great time participating, and we extend our thanks to all the SREs, DBAs, and DevOps engineers who stopped by the booth to discuss their observability experience.
KCD Argentina was additionally a great chance to learn about local community-led initiatives, such as STEAM GIRLS and Comunidad UNLa Sistemas:
UNLa Sistemas is a student community from the National University of Lanús in Buenos Aires Province. Students studying software development, technology, and IT management meet to share knowledge and collaborate on projects, such as setting up and observing a K3s cluster on recycled hardware.
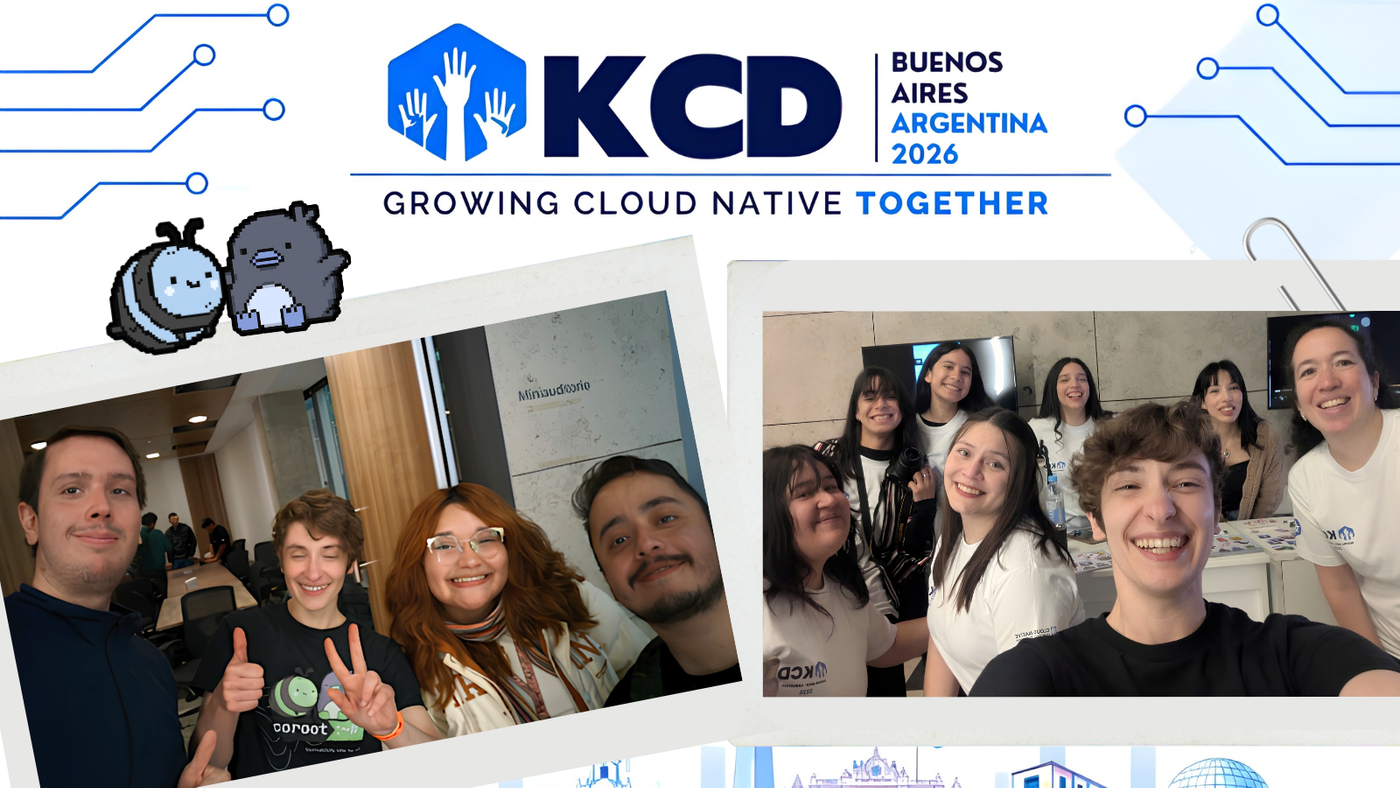
STEAM GIRLS is a community that empowers and connects young women in Science, Technology, Engineering, Arts, and Mathematics fields. STEAM GIRLS regularly hosts educational workshops, meetups, and networking opportunities. As a local in Buenos Aires, you can learn more about how to participate by connecting with an organizer.
For a fun twist at the Coroot booth, we raffled off a lunar rover and shuttle model for any participants who completed a short survey on their observability experience.
50 respondents completed the survey in total. Breakdown of participants by industry role is as follows:
- 39% Software Engineers
- 12% SREs
- 11% SysAdmins
- 15% Marketing & Sales
- 23% in Miscellaneous Roles
Those in unrelated roles who answered “observability does not apply to my job” were excluded from the results below. So, for a quick snapshot of observability experiences at KCD Argentina, Buenos Aires:
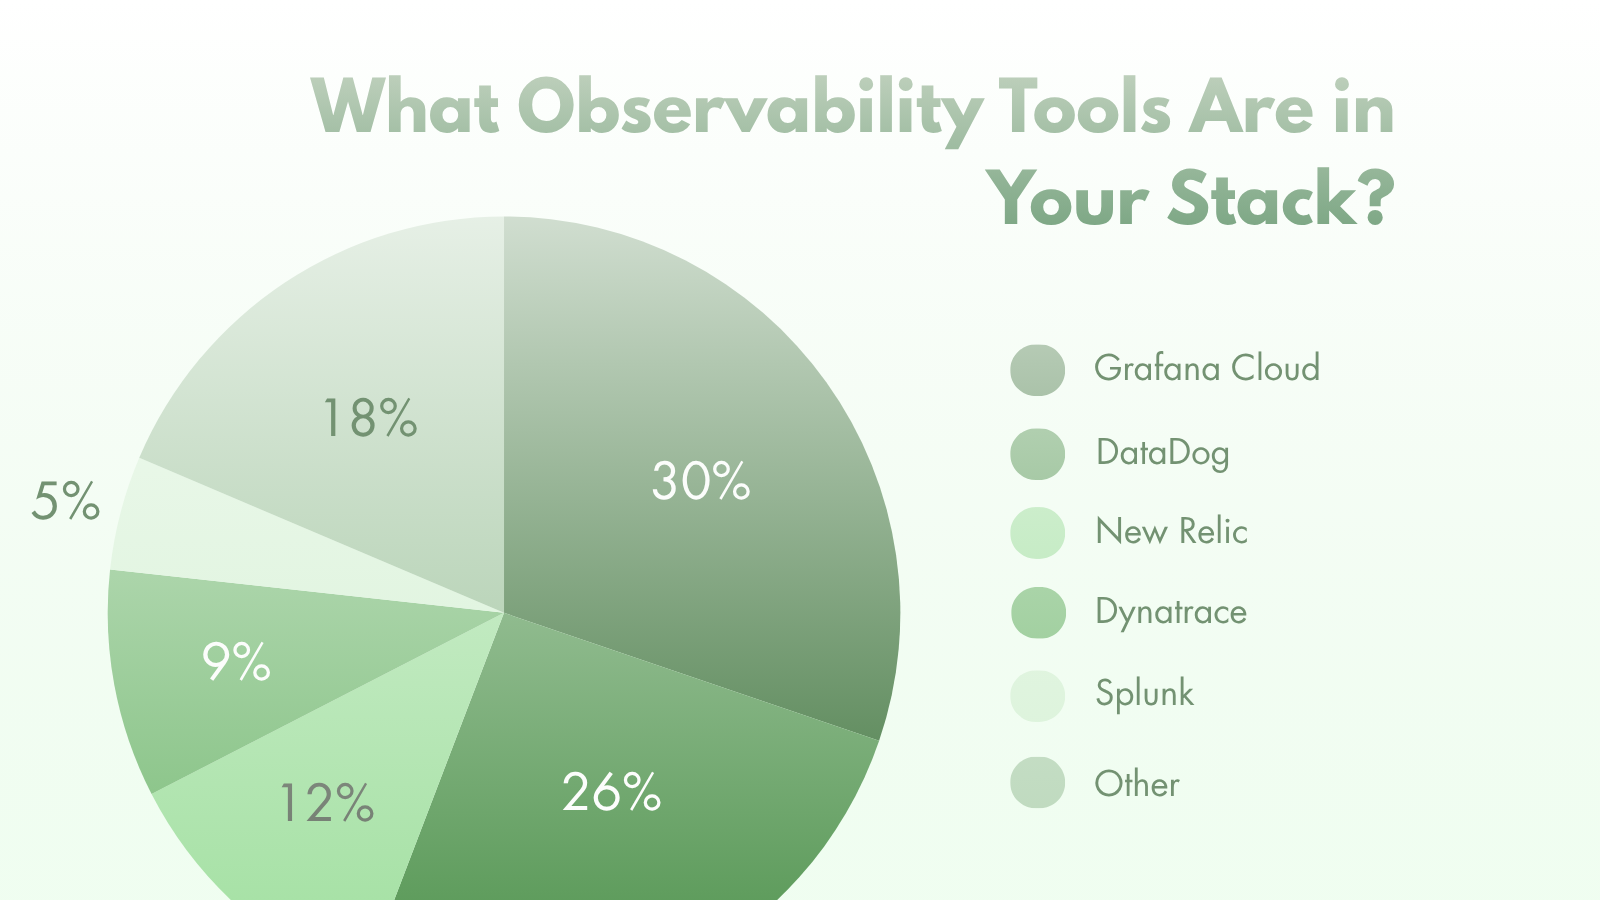
Grafana Cloud, Datadog, and New Relic were the tools most commonly used by respondents. In our conversations at the booth, Splunk and Zabbix were also popular choices for enterprise observability.
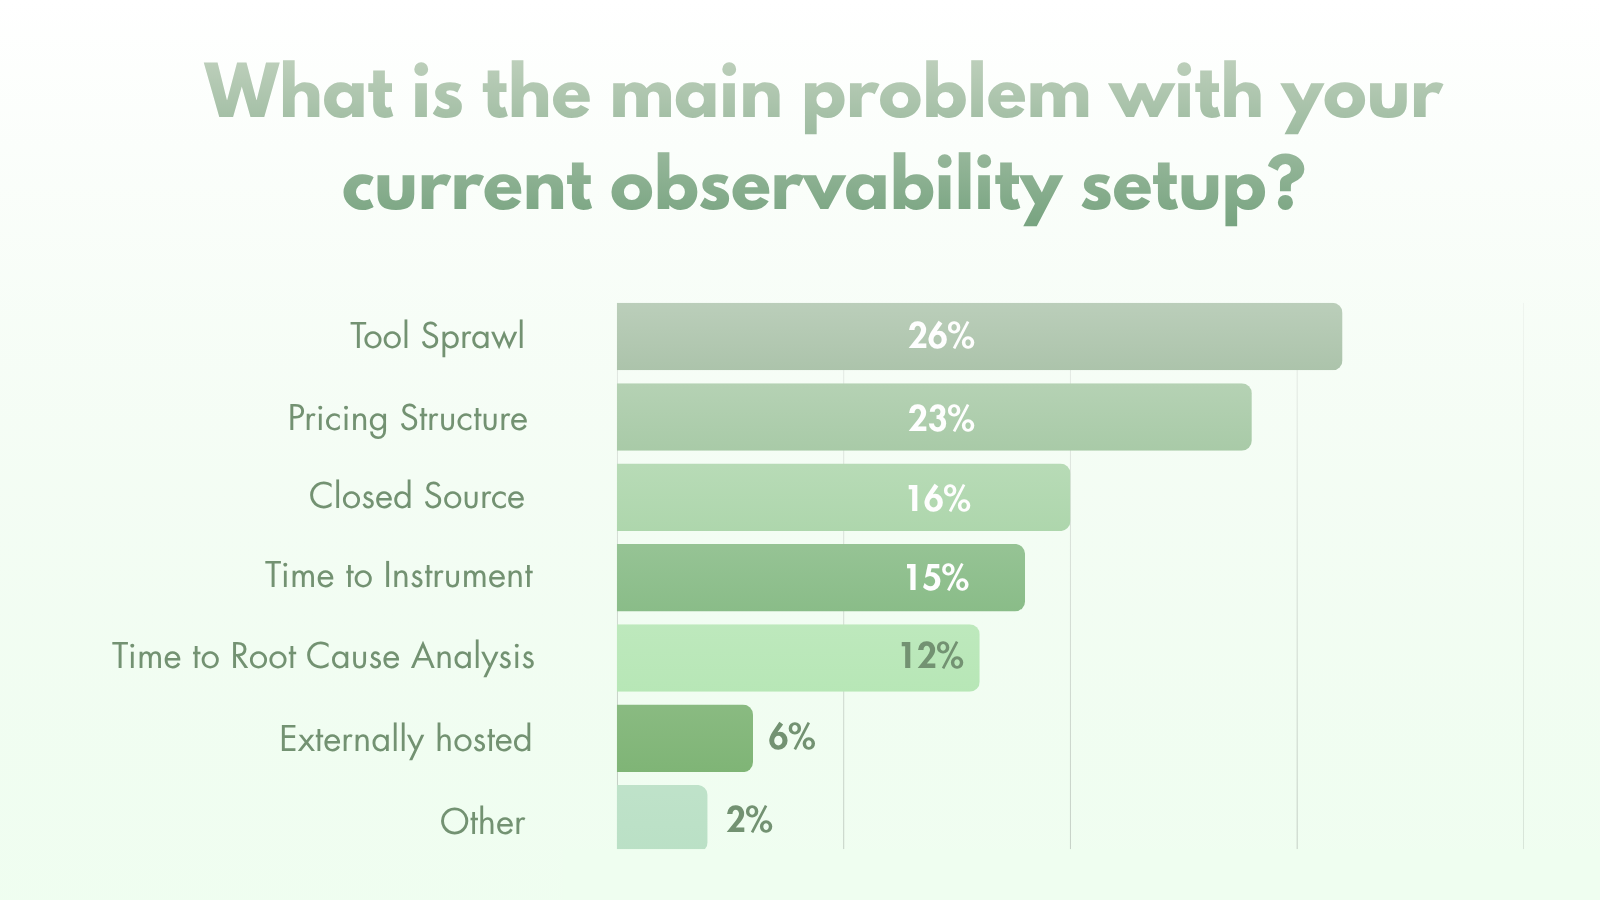
The most frequently reported issue developers faced with their observability stack: tool sprawl. In conversations, developers found themselves frequently stringing together 3-4 disparate tools to achieve complete system coverage, with tools unable to share context.
Affordability was another frequent issue (I’m partial to Kevin Lin's diagrams that illustrate the complexity of pricing models within the enterprise observability market.) Open source was interestingly a strong preference, with frustration currently adopted tools were closed source.
Not shown above: only 8 participants reported they were entirely satisfied with their current setup.
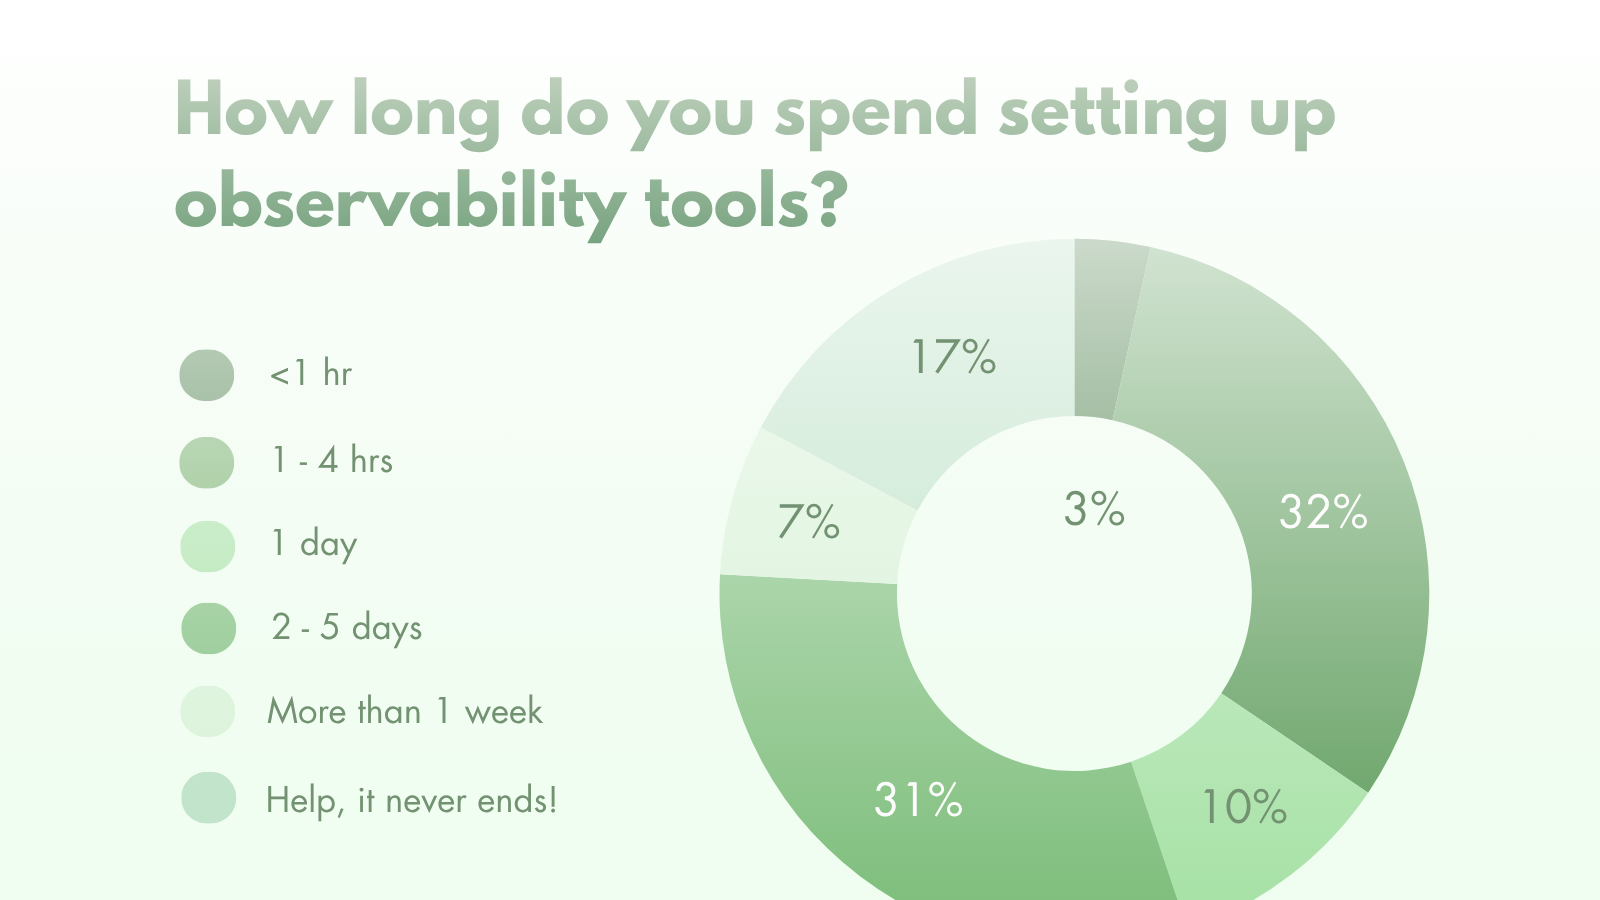
Respondents most often reported spending between 1 - 4 hours or 2 - 5 days instrumenting tools. 17% bemoaned that instrumentation, setup, and maintenance was an ever-ongoing process.
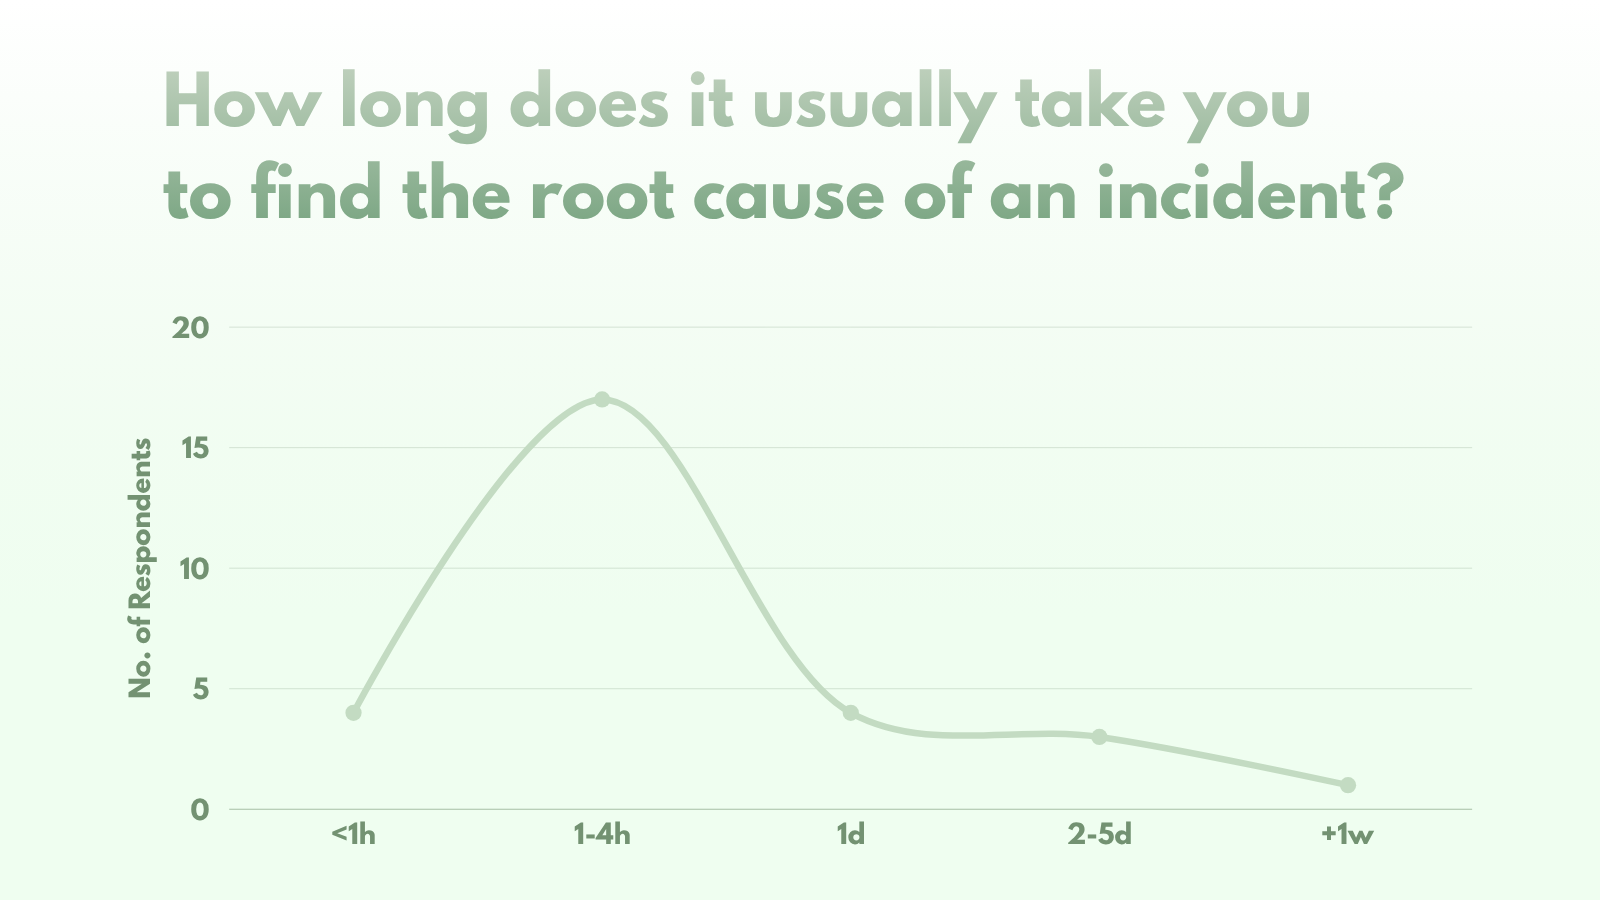
1 - 4 hours was overwhelmingly the most reported time spent on Root Cause Analysis. In conversations at the booth, even if engineers used tools that helped cut back on MTTR, the time spent on incident recovery felt too long and often took away valuable hours from other duties.
Excluded from the graph above: 16% of respondents reported that the time spent diagnosing incidents varied so wildly they couldn’t provide an average, but that it was more time than they would have liked ( "Depende, pero más de lo que me gustaría" )
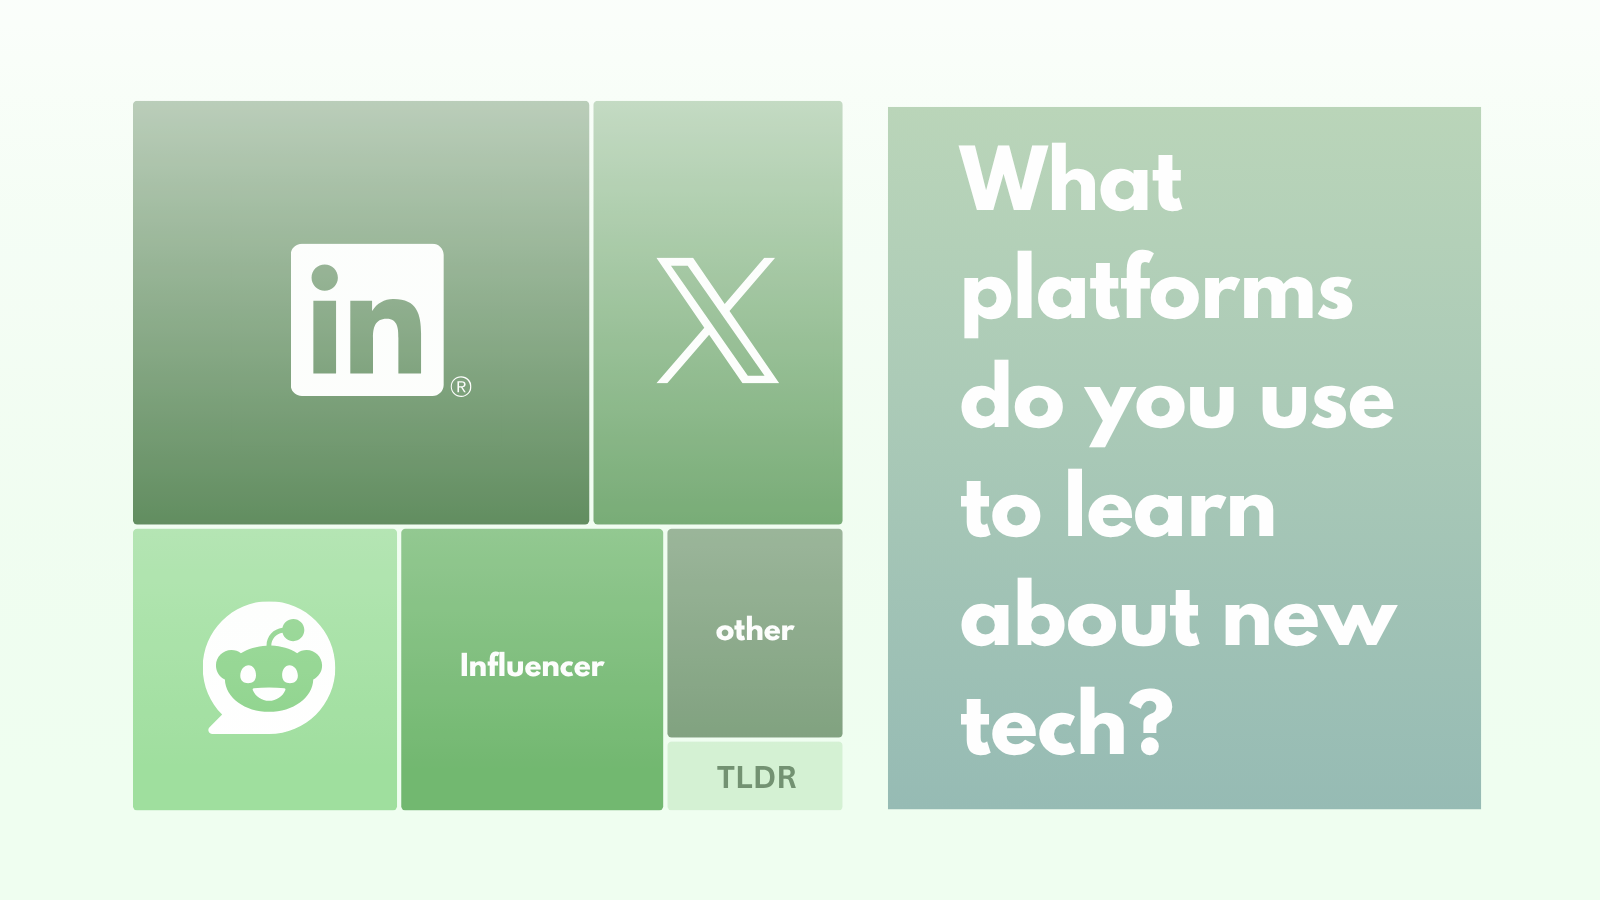
An interesting finding for those marketing local events and technology services in Buenos Aires: respondents overwhelmingly reported they used LinkedIn and X to check for emerging technologies that could be relevant to their work. This came as a surprise choice over more developer-centric platforms, such as Hacker News or Reddit (though it should be noted again, our sample size was very small.)
Pelado Nerdo was a popular local influencer named in a booth conversation, alongside MiDudeDev, a favorite mentioned by attendees at Nerdearla Argentina hosted the week prior.
In conclusion: we loved exploring Buenos Aires. Thank you so much to all the wonderful event organizers of KCD Argentina, Nerdearla, and Percona University who put together all the opportunities to connect with engineers in the observability space we explored September through early October.
Hasta la próxima, Argentina!