
Putting Amazon ECS on the map
 Nikolay Sivko
Say "ECS" and most people picture serverless containers: no nodes to manage, and nothing underneath you are allowed to touch. For an eBPF-based agent that is a dead end. There is no host to run on, no privileged containers, no kernel to attach to.
But ECS is not always serverless. With the EC2 launch type you bring the nodes and ECS brings the scheduler: task definitions, services, rolling deployments, daemons, placement. Plenty of teams run it exactly that way, because real machines are easy to reason about and cheap to run. And real machines are exactly what Coroot's agent needs: one privileged container per node, and it instruments every container on that node automatically, no code changes, no sidecars.
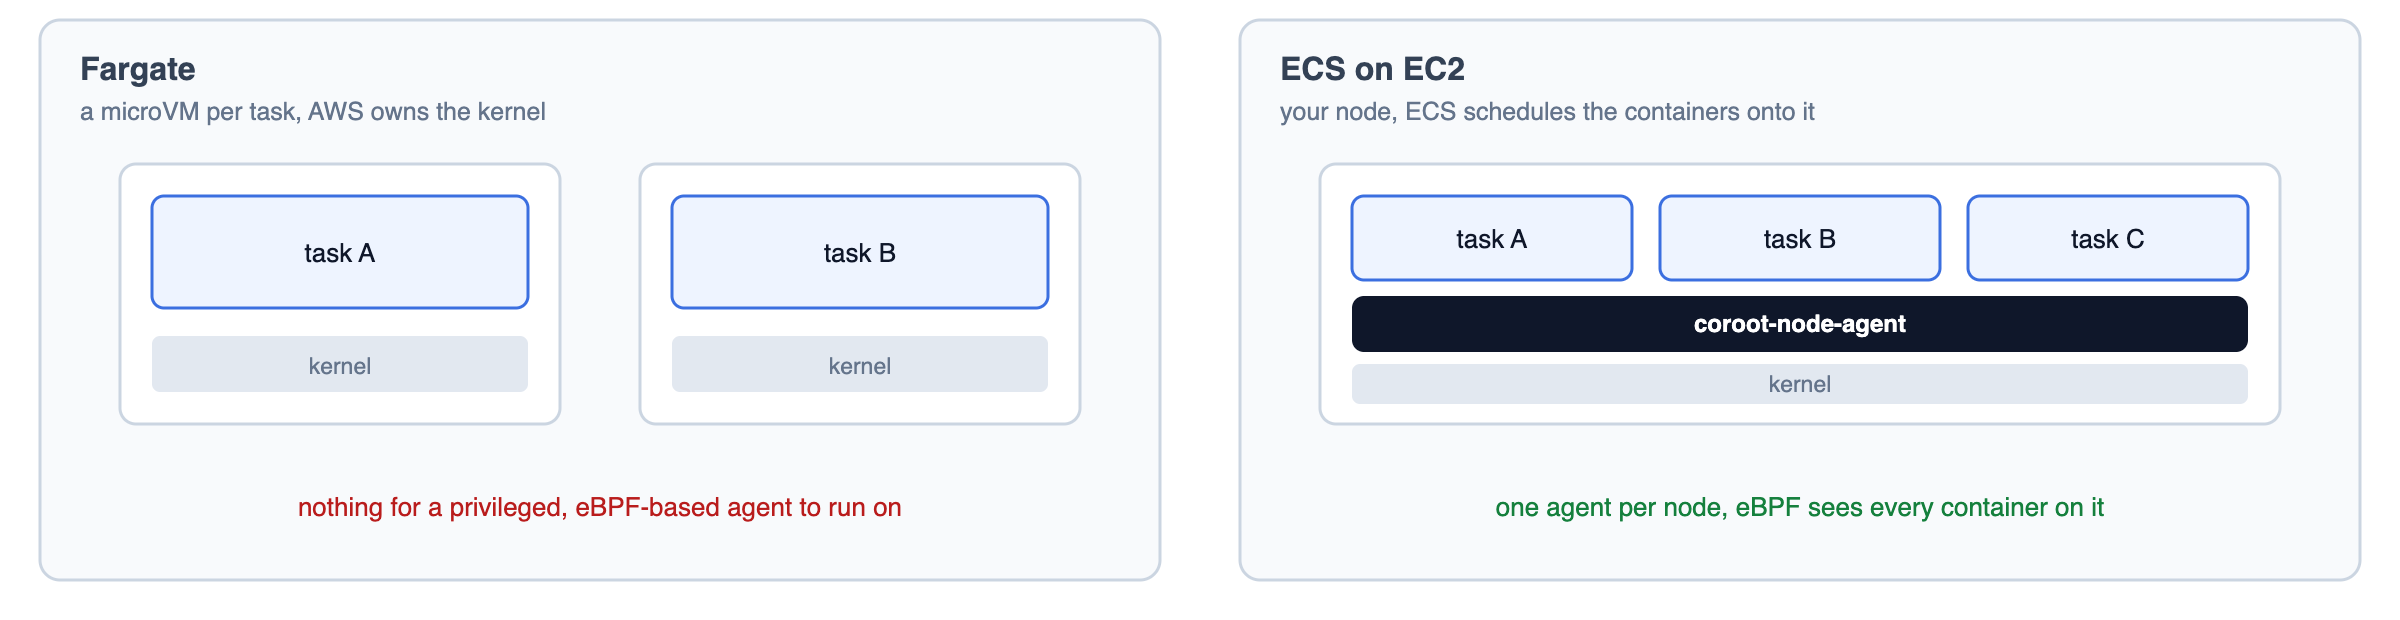
Coroot now supports ECS on EC2: the agent runs as a daemon service, and every container it finds is attributed to its ECS service, task and cluster, so the map comes out right. This post shows how that works, on a small but realistic setup, the kind we see a lot: a company that has run ECS for years, with its Java services and their RDS databases still there, and an EKS cluster next to it where the newer services landed. Nobody is migrating the Java side anywhere, it works. What they want is one map across both. Along the way I'll show what ECS actually looks like from inside a node, because that is what the whole implementation hangs on, and why the same trick is impossible on Fargate.
The setup
To show this on something real rather than a toy, I built the kind of environment I described above: an ECS cluster that has been around for a while, an RDS database behind it, and an EKS cluster next to them, all in one VPC in us-east-1. A load generator drives traffic through the whole thing so there is something to look at.
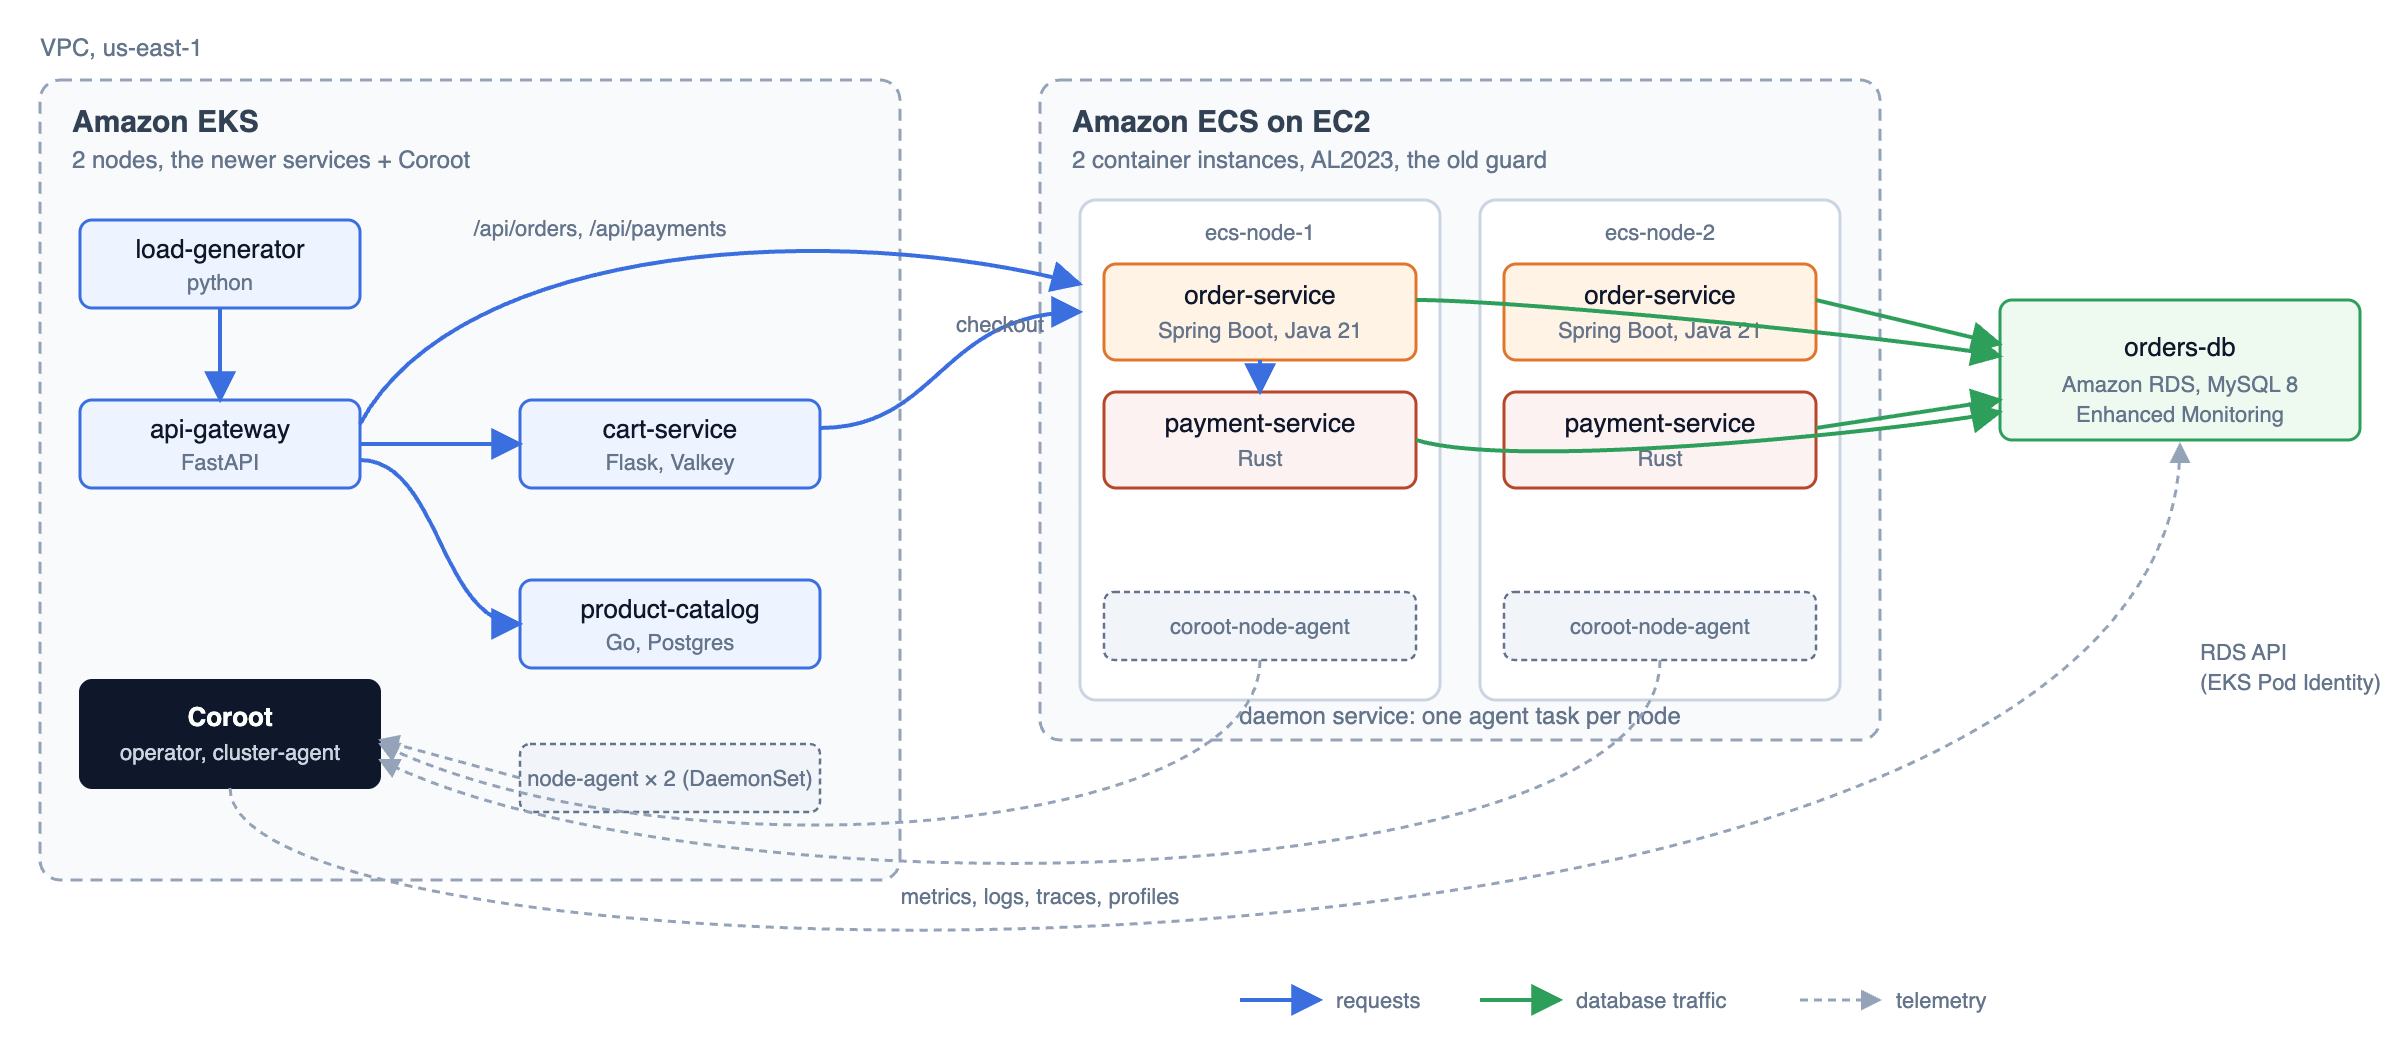
The ECS side is the old guard: two EC2 container instances on the ECS-optimized Amazon Linux 2023 AMI (kernel 6.1, cgroup v2) running order-service, a Spring Boot app on Java 21, and payment-service, a small Rust service, two tasks each in awsvpc mode with Cloud Map giving them DNS names. Their data is in orders-db, RDS MySQL 8 with Enhanced Monitoring on. The newer services and Coroot itself run on a two-node EKS cluster next to it.
A checkout crosses the cluster boundary twice: cart-service on EKS calls order-service on ECS, which writes to RDS and then calls payment-service, which writes to RDS too. Pods have VPC addresses, so a pod and a task talk to each other directly.
Installing the agent on ECS
Coroot's node agent needs to run on every node, because that is where the eBPF programs live. On Kubernetes that is a DaemonSet. ECS has the exact same concept, it just calls it a service with the DAEMON scheduling strategy: ECS runs one task on every container instance in the cluster, including instances added later.
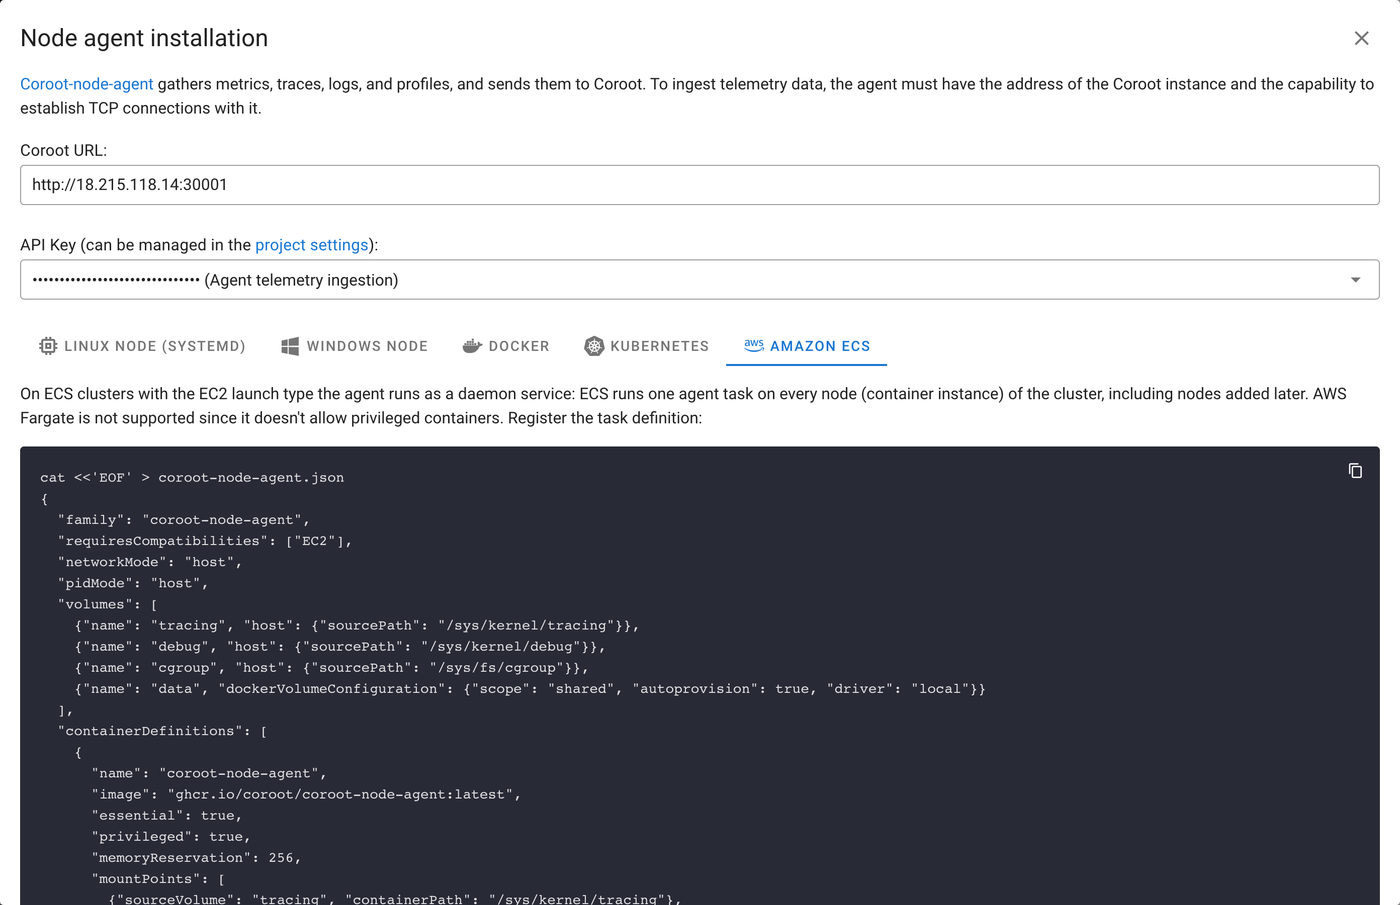
The task definition is the ECS translation of what the agent needs everywhere else: host network and PID namespaces, a privileged container, and the kernel's tracing and cgroup filesystems mounted in. Coroot generates it for you on the agent installation page, with your Coroot URL and API key filled in:
{
  "family": "coroot-node-agent",
  "requiresCompatibilities": ["EC2"],
  "networkMode": "host",
  "pidMode": "host",
  "volumes": [
    {"name": "tracing", "host": {"sourcePath": "/sys/kernel/tracing"}},
    {"name": "debug", "host": {"sourcePath": "/sys/kernel/debug"}},
    {"name": "cgroup", "host": {"sourcePath": "/sys/fs/cgroup"}},
    {"name": "data", "dockerVolumeConfiguration": {"scope": "shared", "autoprovision": true, "driver": "local"}}
  ],
  "containerDefinitions": [
    {
      "name": "coroot-node-agent",
      "image": "ghcr.io/coroot/coroot-node-agent:latest",
      "essential": true,
      "privileged": true,
      "memoryReservation": 256,
      "environment": [
        {"name": "ENABLE_JAVA_TLS", "value": "true"},
        {"name": "ENABLE_JAVA_ASYNC_PROFILER", "value": "true"}
      ],
      "mountPoints": [
        {"sourceVolume": "tracing", "containerPath": "/sys/kernel/tracing"},
        {"sourceVolume": "debug", "containerPath": "/sys/kernel/debug"},
        {"sourceVolume": "cgroup", "containerPath": "/host/sys/fs/cgroup", "readOnly": true},
        {"sourceVolume": "data", "containerPath": "/data"}
      ],
      "command": [
        "--cgroupfs-root=/host/sys/fs/cgroup",
        "--wal-dir=/data",
        "--collector-endpoint=http://coroot.example.com:8080",
        "--api-key=<API_KEY>",
        "--scrape-interval=15s"
      ]
    }
  ]
}
Then it is two commands:
aws ecs register-task-definition --cli-input-json file://coroot-node-agent.json
aws ecs create-service --cluster ecs-demo --service-name coroot-node-agent \
  --task-definition coroot-node-agent --launch-type EC2 --scheduling-strategy DAEMON
A minute later both container instances had an agent task running, and both nodes appeared in Coroot. Upgrading is aws ecs update-service --force-new-deployment, removing it is aws ecs delete-service --force. That's the whole operational surface. The full page is in the docs.
One thing I want to be clear about: this is for ECS on EC2 only. I'll get to Fargate at the end, because the reason it can't work there is actually interesting.
What ECS looks like from inside a node
ECS on EC2 is Docker underneath. The ECS agent is itself a container that talks to the Docker daemon and starts your tasks as ordinary containers, so everything our agent needs to know about a task is there in Docker's view of the container. This is the order service, inspected on the node:
$ docker inspect $C --format '{{json .Config.Labels}}' | jq
{
  "com.amazonaws.ecs.cluster": "ecs-demo",
  "com.amazonaws.ecs.container-name": "order-service",
  "com.amazonaws.ecs.task-arn": "arn:aws:ecs:us-east-1:123456789012:task/ecs-demo/d6350900ca7643279a468df08d8af652",
  "com.amazonaws.ecs.task-definition-family": "order-service",
  "com.amazonaws.ecs.task-definition-version": "1"
}
That's most of what we need, sitting right there in the labels: the cluster, the container's name within the task, the task ARN (the last segment is the task ID), and the task definition family. The agent reads them through the Docker API, the same way it reads the labels of Docker Swarm services.
The agent finds out which container a process belongs to from its cgroup path, and ECS has its own layout. On this AL2023 node with cgroup v2 it is:
0::/ecstasks.slice/ecstasks-d6350900ca7643279a468df08d8af652.slice/docker-90fe4e2aa09d...875e.scope
A slice per task, and inside it the usual docker-<id>.scope. On cgroup v1 (the end-of-life Amazon Linux 2 AMIs) it is /ecs/<task-id>/<container-id>. Both parse to a Docker container ID, and from there the labels do the rest.
The one thing the labels don't tell you
Look at the labels again. There is a task definition family, but there is no service name. In ECS, a service is the thing that keeps N copies of a task definition running, so it is the service, not the family, that corresponds to a Kubernetes Deployment. Usually they share a name, but they don't have to, and when a family is shared between services you really want to group by service.
The service name is available, though, from the task metadata endpoint. Every ECS container gets an ECS_CONTAINER_METADATA_URI_V4 environment variable pointing at http://169.254.170.2/v4/<id>, and GET <uri>/task describes the whole task. Trimmed down, this is what it returns for the order service:
{
  "Cluster": "ecs-demo",
  "TaskARN": "arn:aws:ecs:us-east-1:123456789012:task/ecs-demo/d6350900ca7643279a468df08d8af652",
  "Family": "order-service",
  "Revision": "1",
  "LaunchType": "EC2",
  "AvailabilityZone": "us-east-1a",
  "Containers": [
    {
      "DockerId": "2ec58ba8300943e374f25cffaeb996985101985448a0e48a7e21f3f9dcb02f8c",
      "Name": "~internal~ecs~pause",
      "Image": "amazon/amazon-ecs-pause:0.1.0",
      "Type": "CNI_PAUSE",
      "Networks": [{"NetworkMode": "awsvpc", "IPv4Addresses": ["172.31.14.76"]}]
    },
    {
      "DockerId": "90fe4e2aa09d1801020e136ca407da612896a90d5563bf98b704120e1a6c875e",
      "Name": "order-service",
      "Image": "failurepedia/demo-order-service:blog",
      "Labels": {
        "com.amazonaws.ecs.cluster": "ecs-demo",
        "com.amazonaws.ecs.container-name": "order-service",
        "com.amazonaws.ecs.task-arn": "arn:aws:ecs:us-east-1:123456789012:task/ecs-demo/d6350900ca7643279a468df08d8af652",
        "com.amazonaws.ecs.task-definition-family": "order-service",
        "com.amazonaws.ecs.task-definition-version": "1"
      },
      "Limits": {"CPU": 2, "Memory": 1536},
      "Type": "NORMAL",
      "Networks": [{"NetworkMode": "awsvpc", "IPv4Addresses": ["172.31.14.76"]}]
    }
  ],
  "ServiceName": "order-service"
}
There it is, ServiceName, at the very bottom. The agent reads each container's environment from the Docker API, picks the URI up from there and asks for the task document. The endpoint is served by the ECS agent on the node, and it is reachable from the host network namespace too, which is where our agent runs. Tasks started with run-task have no service, so for those the family is used instead. (Also note the second container in the list, we'll get to it in a moment.)
Putting it together, every ECS container now gets an ID like this:
/ecs/ecs-demo/order-service/d6350900ca7643279a468df08d8af652/order-service
Cluster, service, task, container. Coroot turns that into an application order-service of a new kind, ECSService, in the namespace ecs-demo, with one instance per task.
The pause container
If you run tasks in awsvpc mode, each task gets its own elastic network interface, and someone has to hold the network namespace for the task's containers. ECS does exactly what Kubernetes does: it starts an infrastructure container first and the application containers join its namespace. That is the ~internal~ecs~pause container of type CNI_PAUSE in the metadata above, and on the node it is a plain Docker container next to the app:
$ docker ps --format '{{.Names}}' | grep order
ecs-order-service-1-order-service-e0cce090e5b0e5e6ea01
ecs-order-service-1-internalecspause-f6c2c183fda5d4813900
Taken at face value, a pause container is just another container of the task, and it would show up as an extra instance with zero traffic in every awsvpc service. The agent recognizes the name and skips it, the same way it skips Kubernetes sandbox containers. The application container's sockets are what matter, and those are attributed to the right place.
The map
This is what the whole thing looks like once both agents and the AWS integration are reporting:
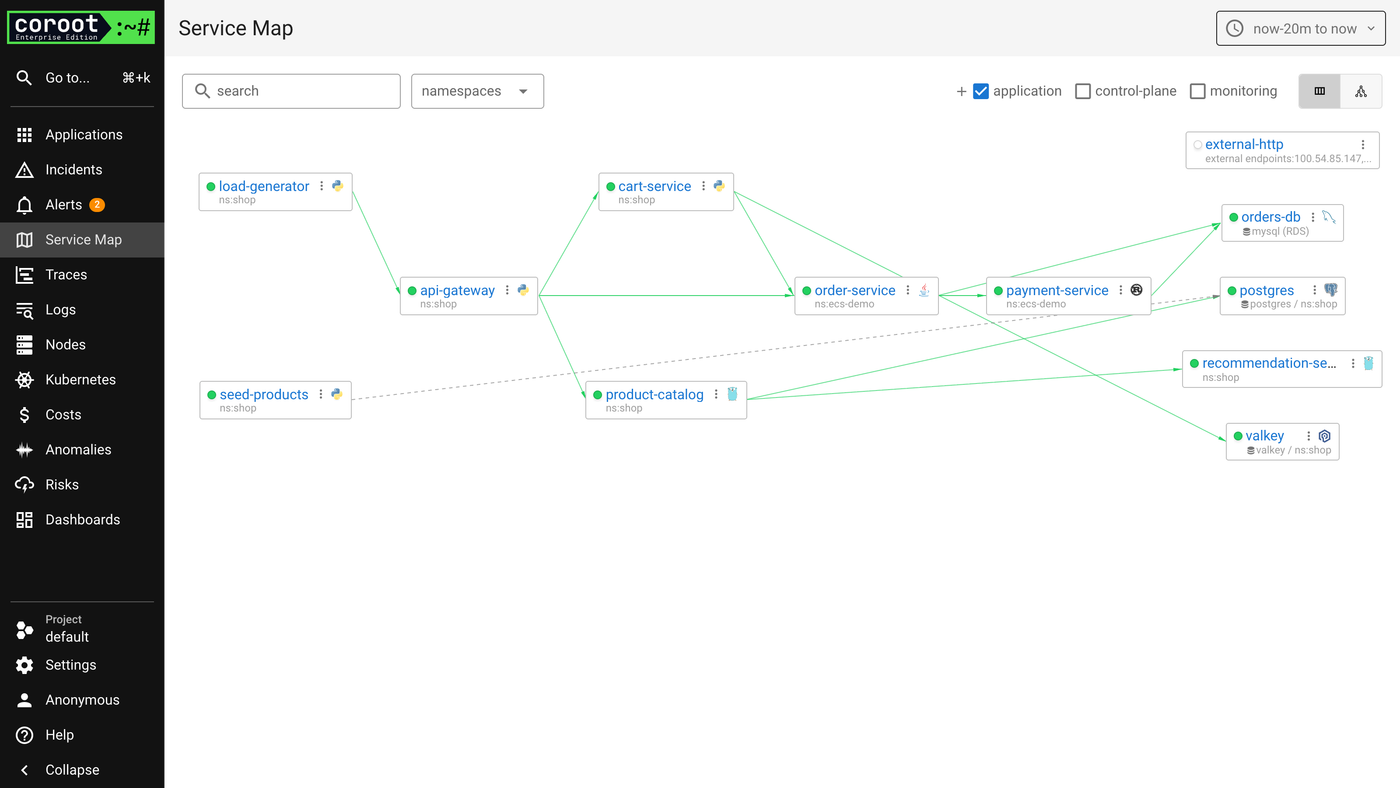
EKS on the left, the two ECS services in the middle under their cluster's name, ecs-demo, and orders-db tagged as mysql (RDS) on the right. The edges that cross from EKS into ECS and from ECS into RDS are the whole point, and nothing here was configured: every edge is a TCP connection seen by eBPF on one of the four nodes, resolved to whatever listens on the other end. For the RDS address, the other end is the instance the cluster-agent discovered through the AWS API with the read-only IAM role it gets through EKS Pod Identity.
Inside the Java service
The order service is where I expected ECS to make life harder, and it didn't. Here is its application page:
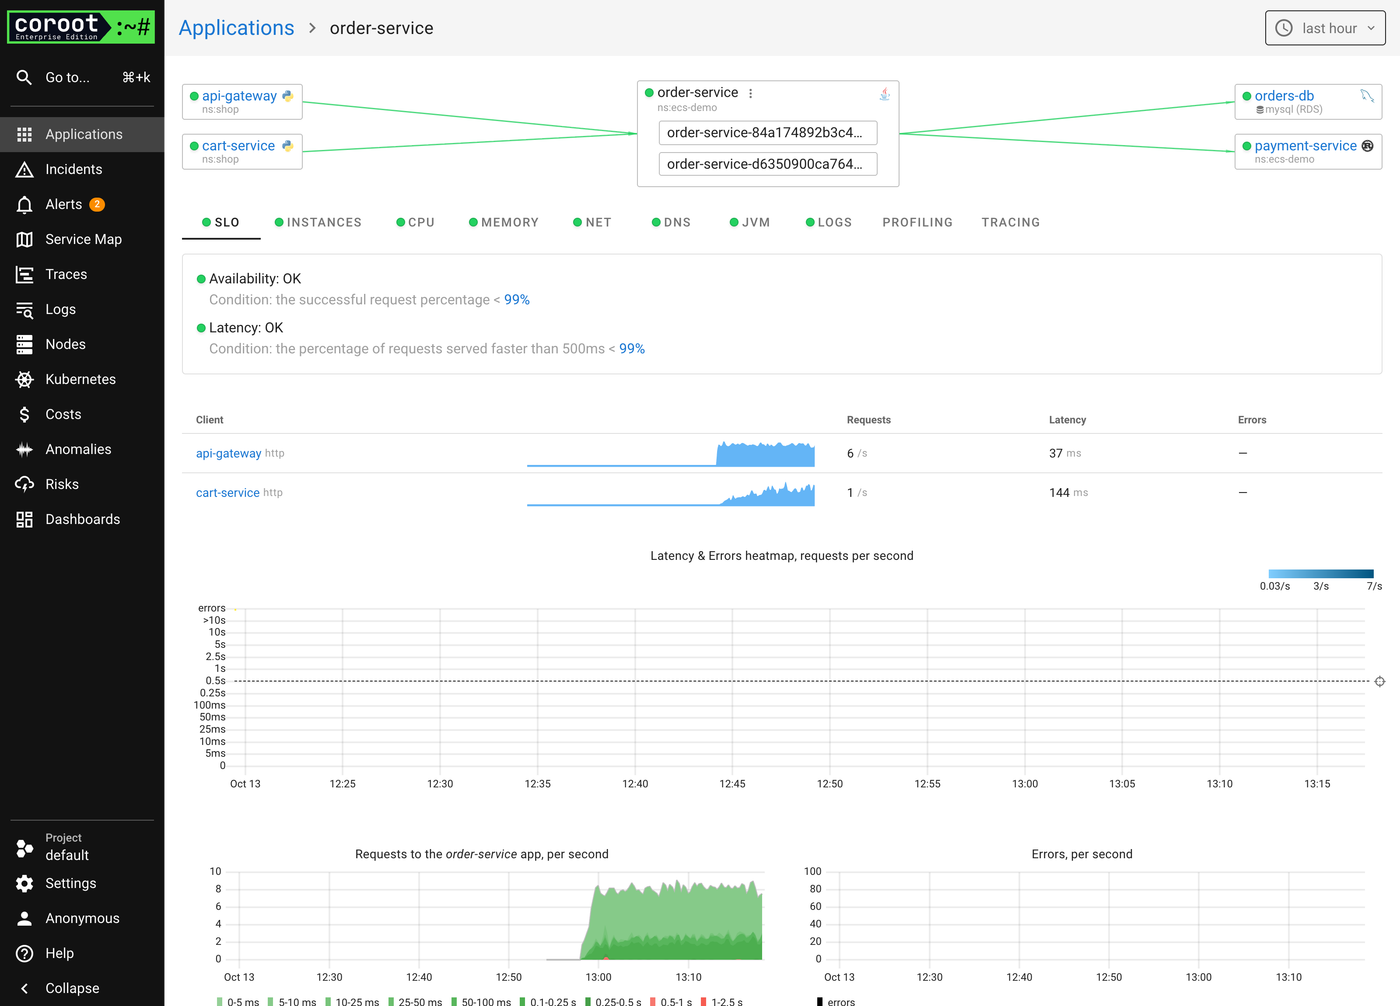
The two instances are named after the ECS tasks, order-service-<task id>, so they line up with what aws ecs list-tasks prints. The SLOs on top are the defaults Coroot applies to every application: availability and a latency threshold, computed from the eBPF-measured requests, and the client table below breaks the traffic down by caller, so the checkout calls from cart-service and the direct calls from api-gateway are visible separately with their own latency.
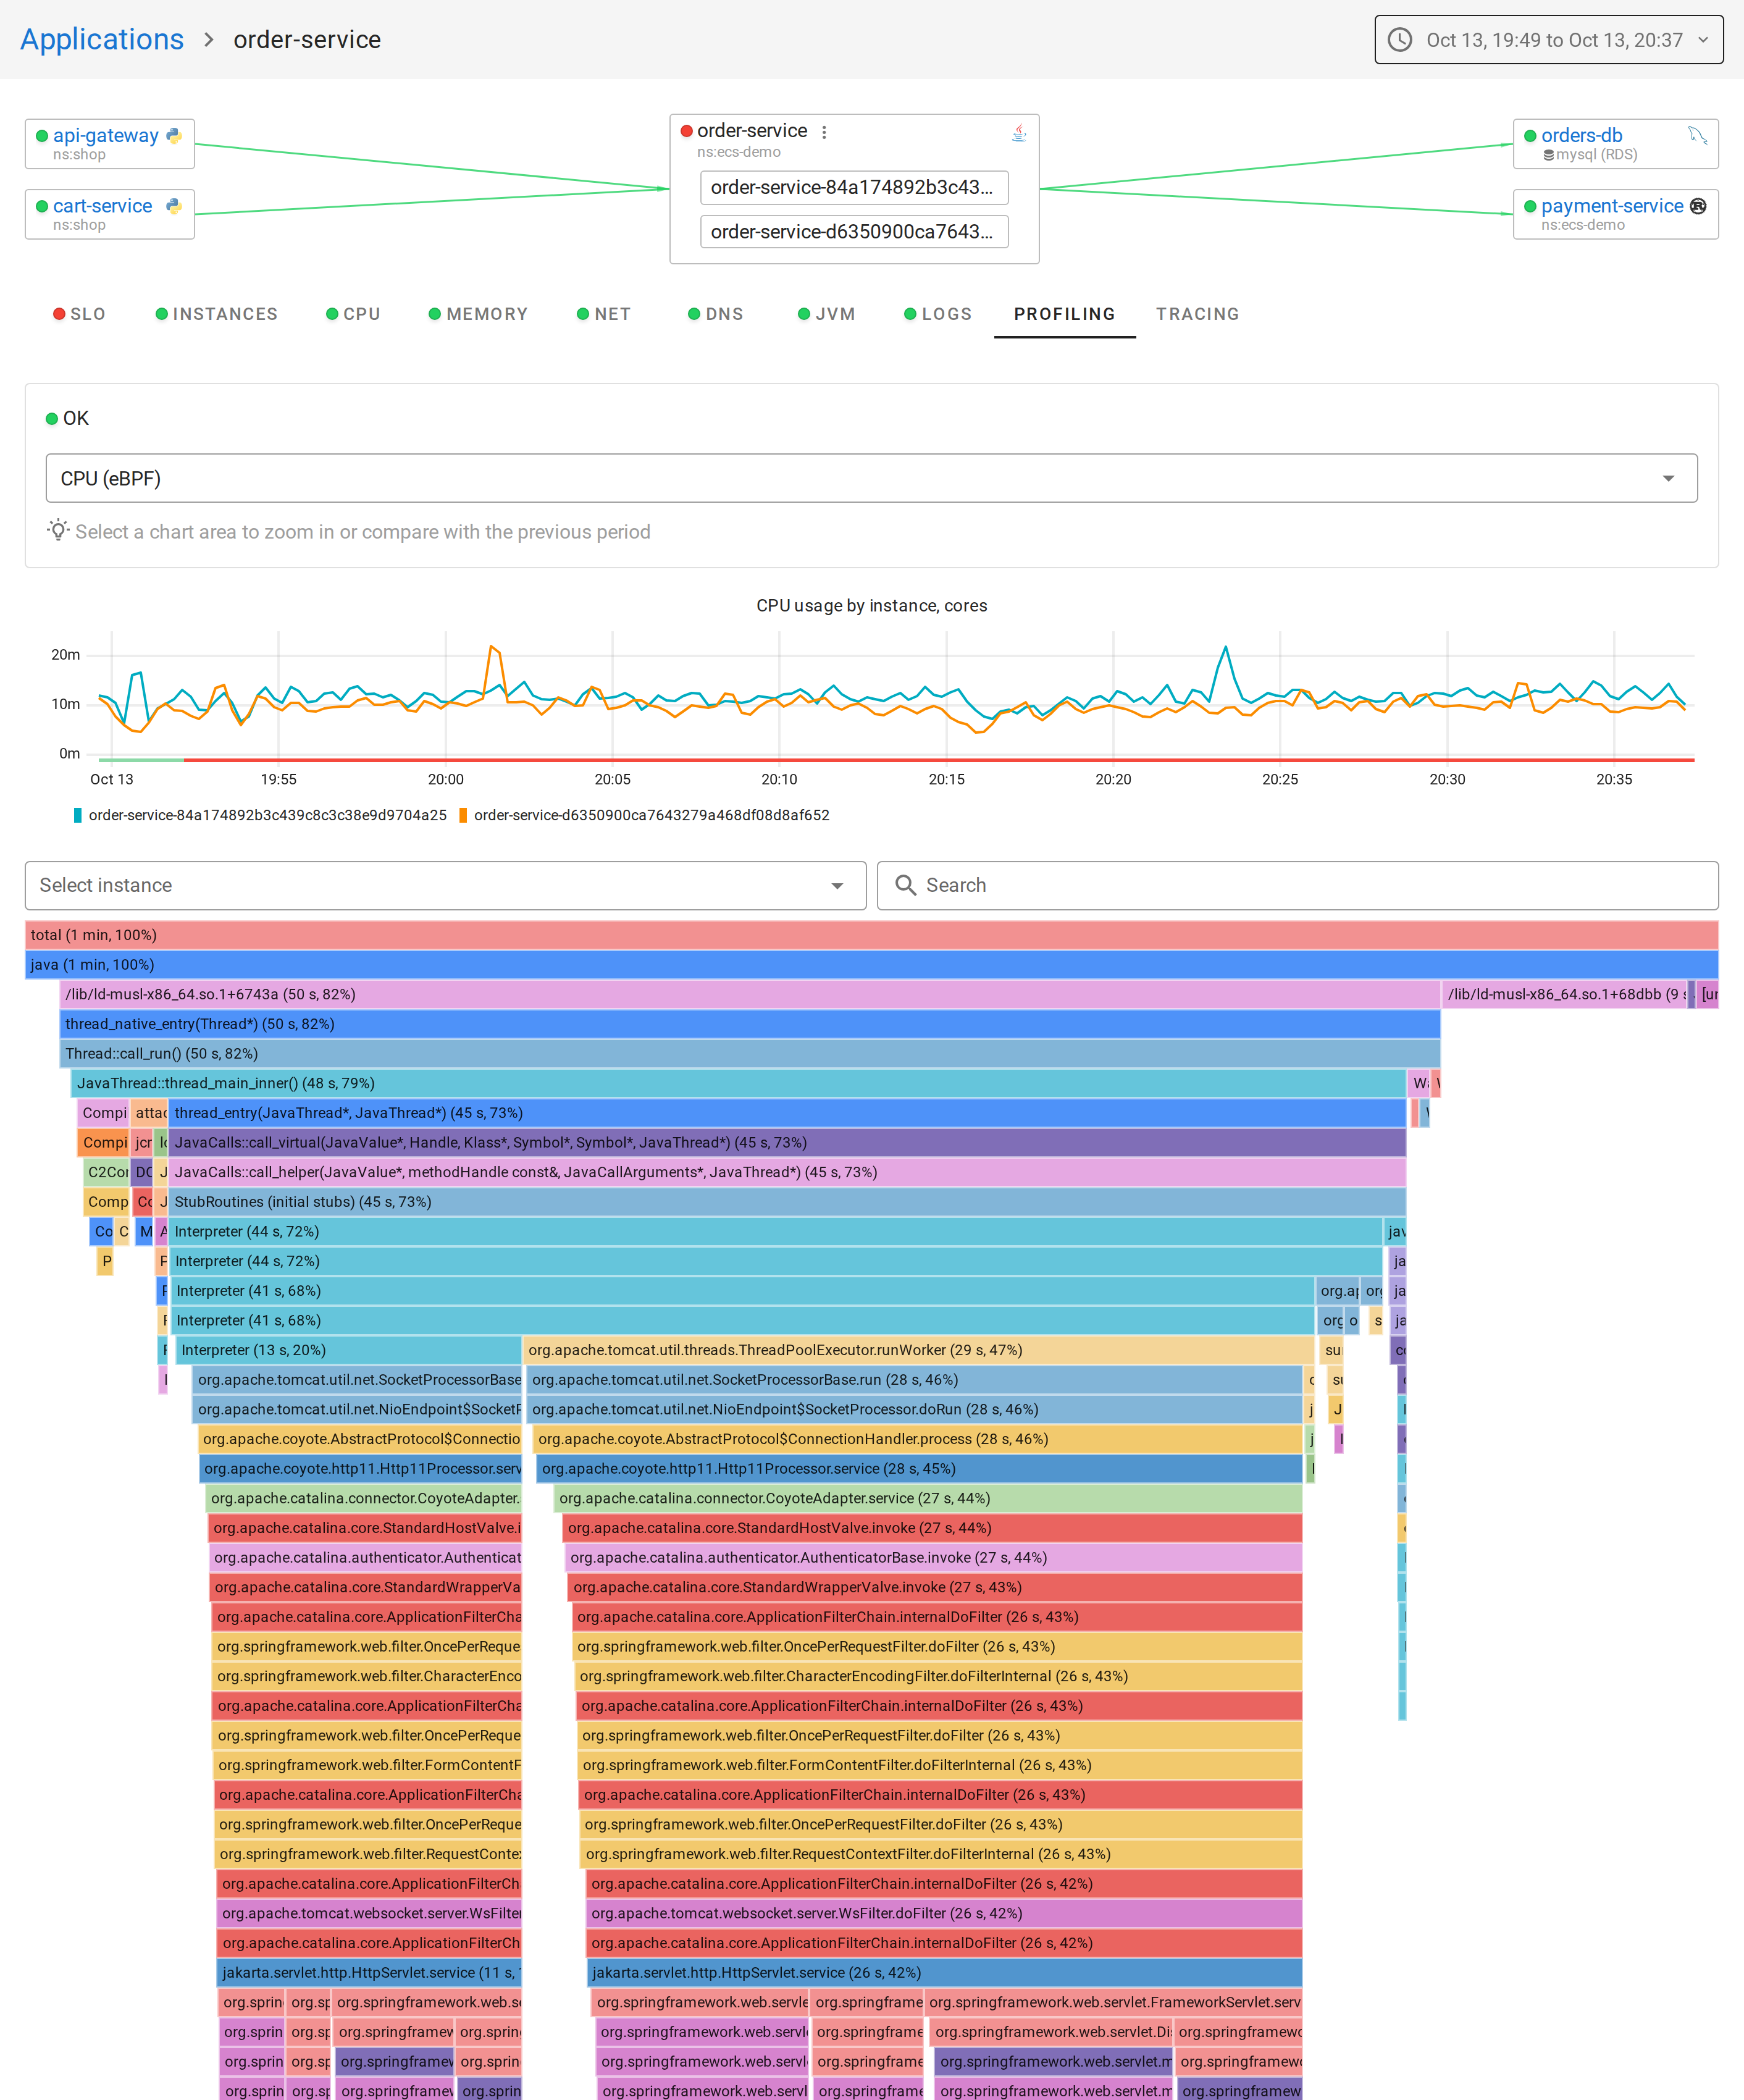
Two things worth pointing out. The JVM tab works because the agent reads the hsperfdata files the JVM writes, and on ECS those are inside the container just like anywhere else. And the continuous profiler works too. The agent drives async-profiler inside the JVM, so the flame graph has real method names, not just addresses:
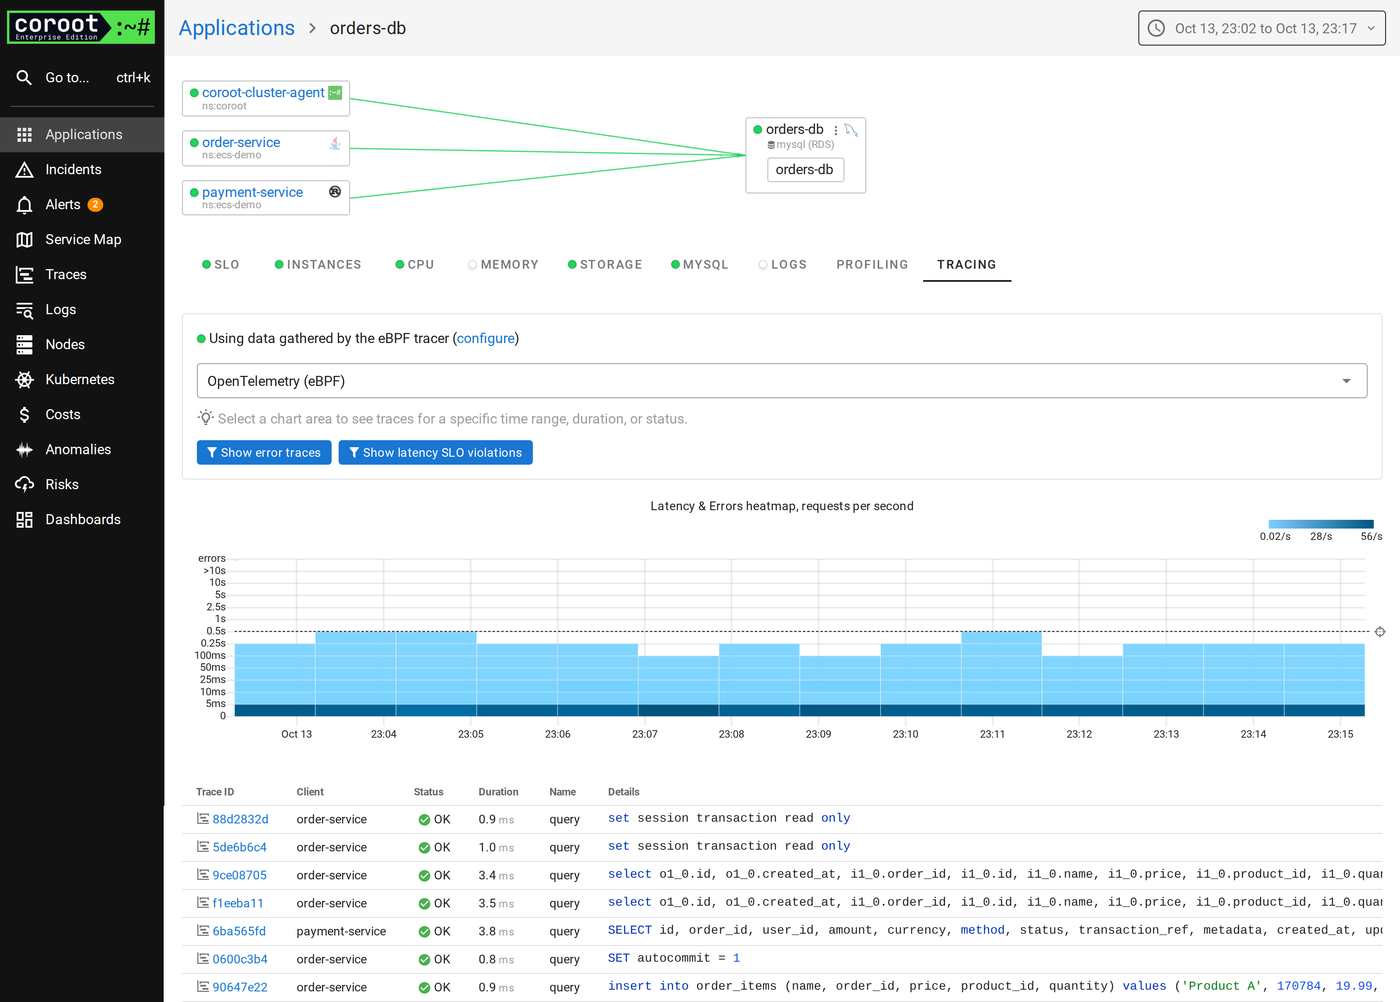
The queries to RDS are captured on the wire by eBPF, so Coroot sees every SELECT and INSERT with its latency, without the app having an OpenTelemetry SDK. One detail worth knowing: the JDBC connection to RDS is encrypted (sslMode=REQUIRED), and encrypted traffic is opaque to the kernel-side tracer. The agent handles that with uprobes on the JVM's TLS implementation, which is enabled by setting ENABLE_JAVA_TLS=true in the agent's environment. With that in the task definition, the MySQL queries show up just like plaintext ones:
Breaking it
To see what an incident looks like, I ran sales reports against the production database: 16 pods on EKS looping GROUP BY queries over payments and orders. On a db.t3.micro that is enough.
order-service has an SLO of 99.9% of requests under 250ms. Three minutes later Coroot opened an incident:
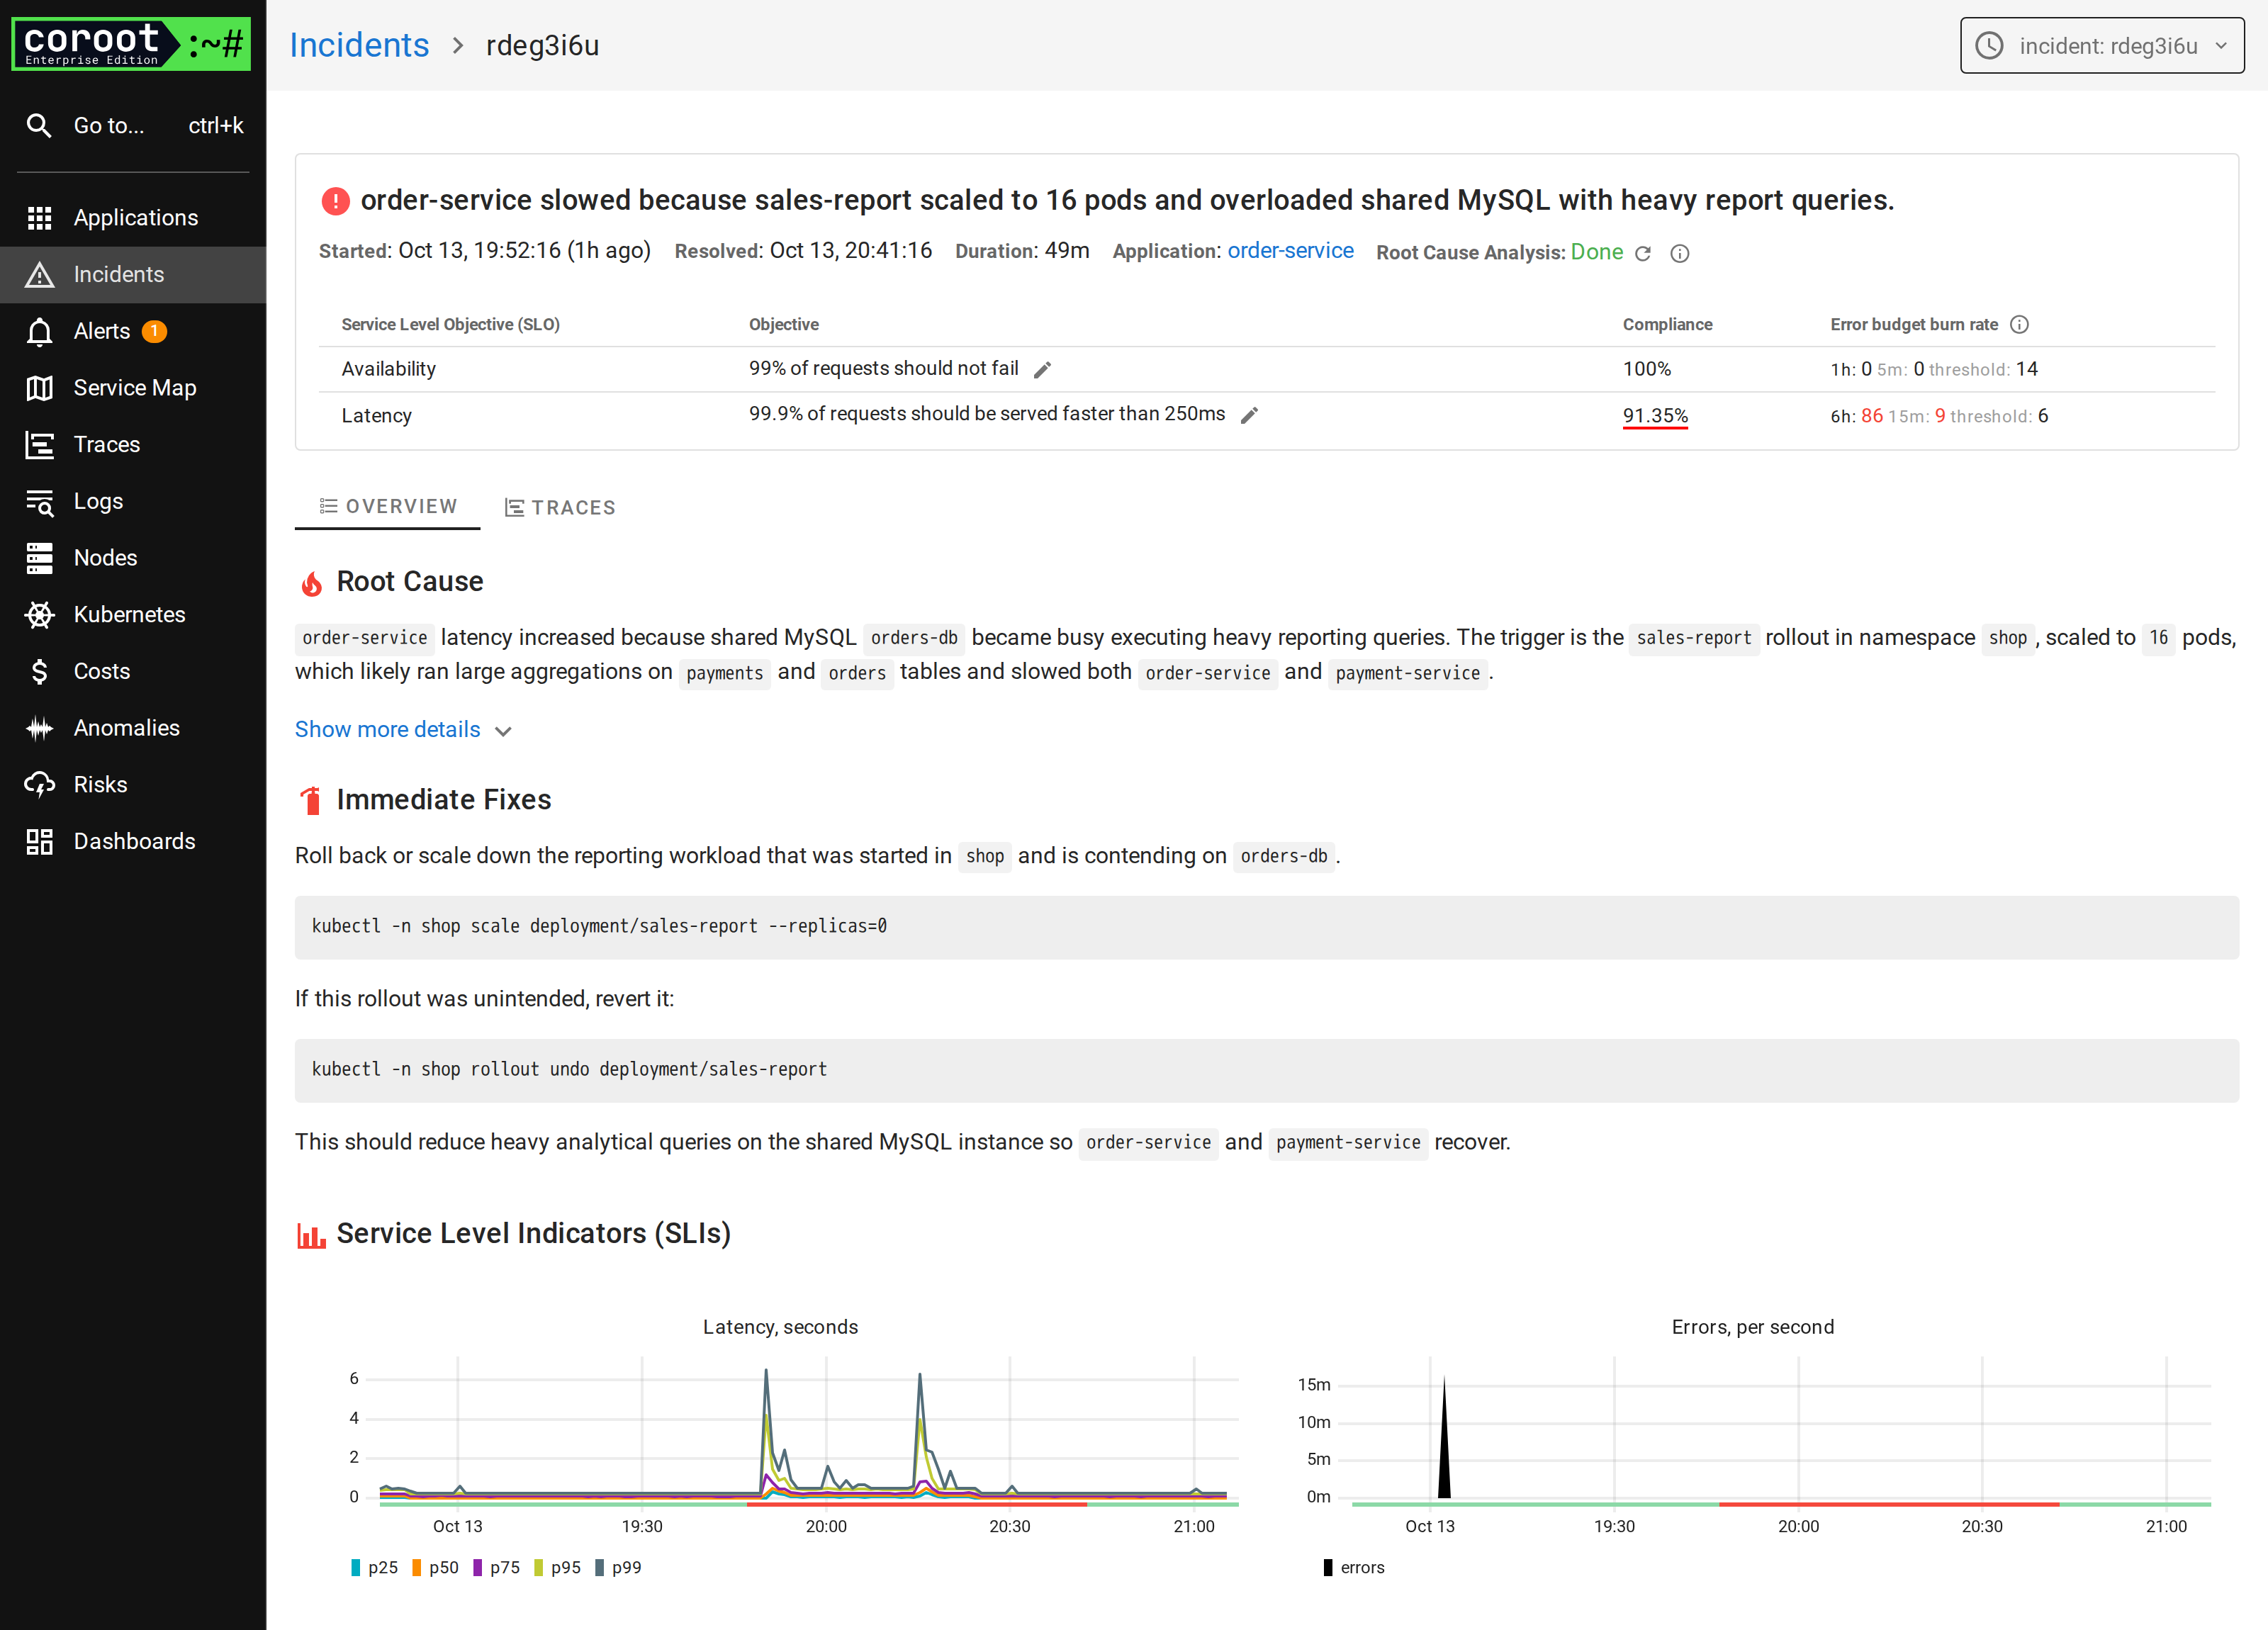
The AI root cause analysis, unedited:
order-service latency increased because shared MySQL orders-db became busy executing heavy reporting queries. The trigger is the sales-report rollout in namespace shop, scaled to 16 pods, which likely ran large aggregations on payments and orders tables and slowed both order-service and payment-service.
And the evidence behind it, one chart per step:
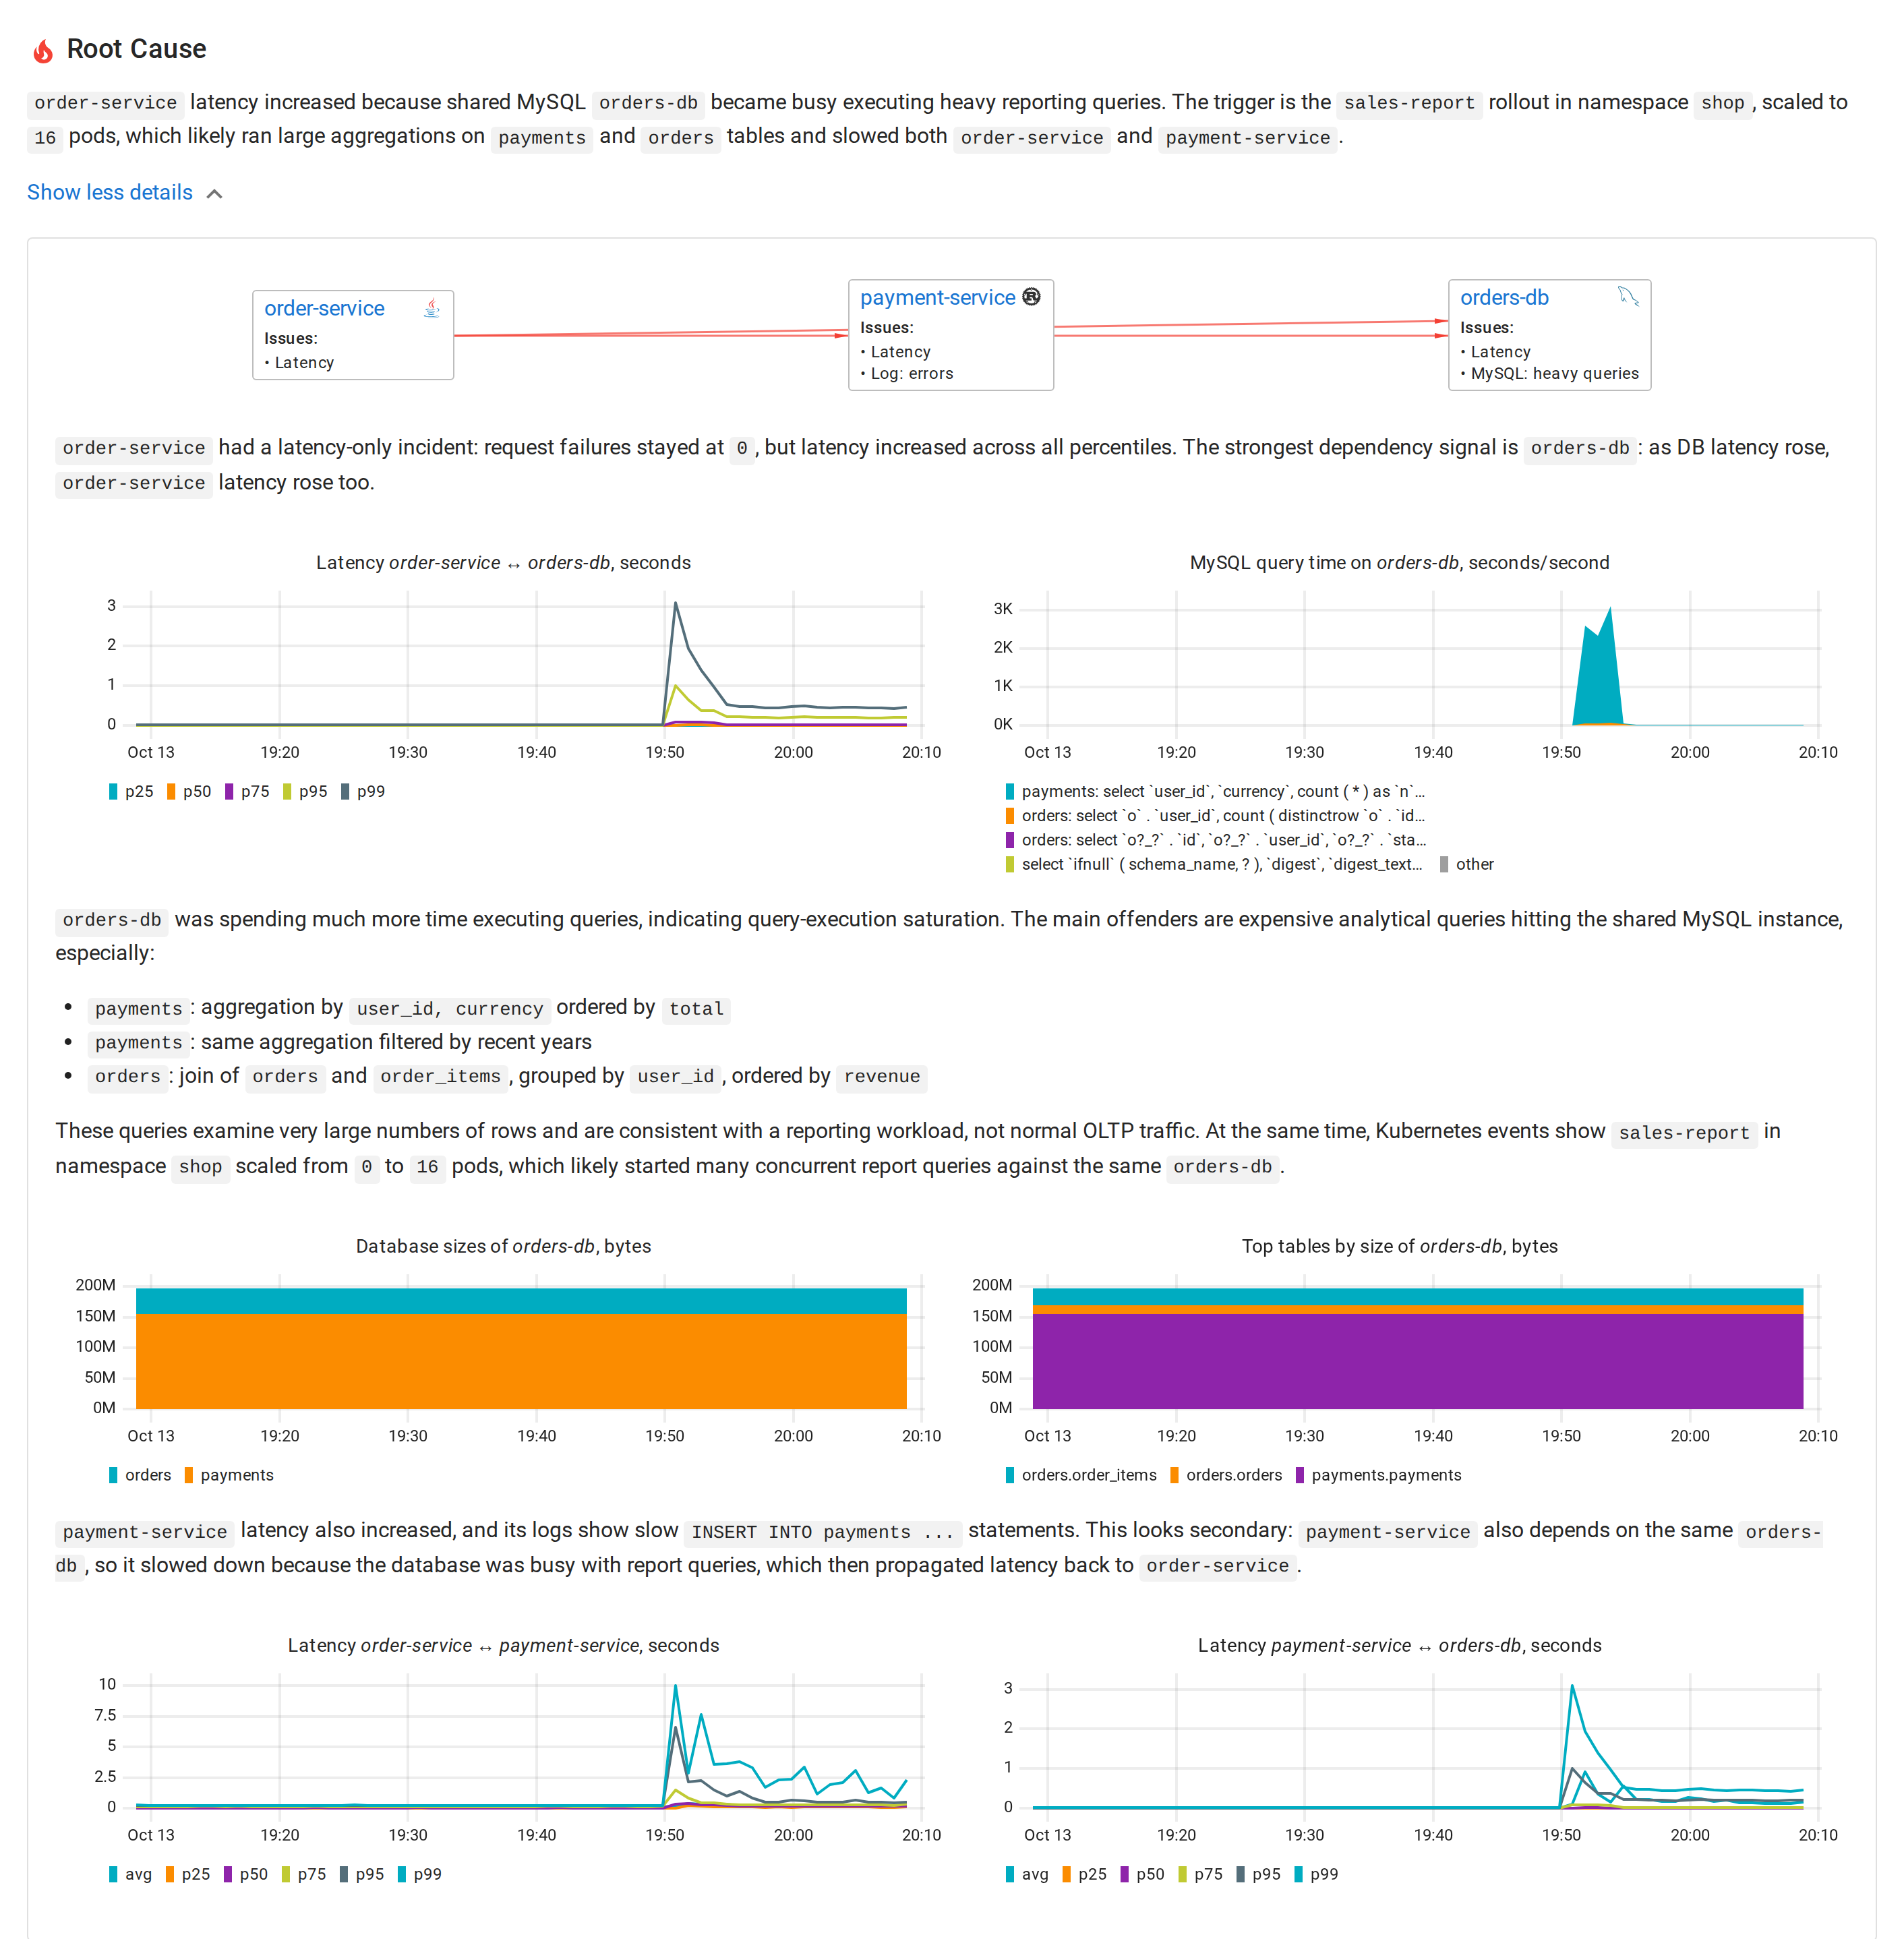
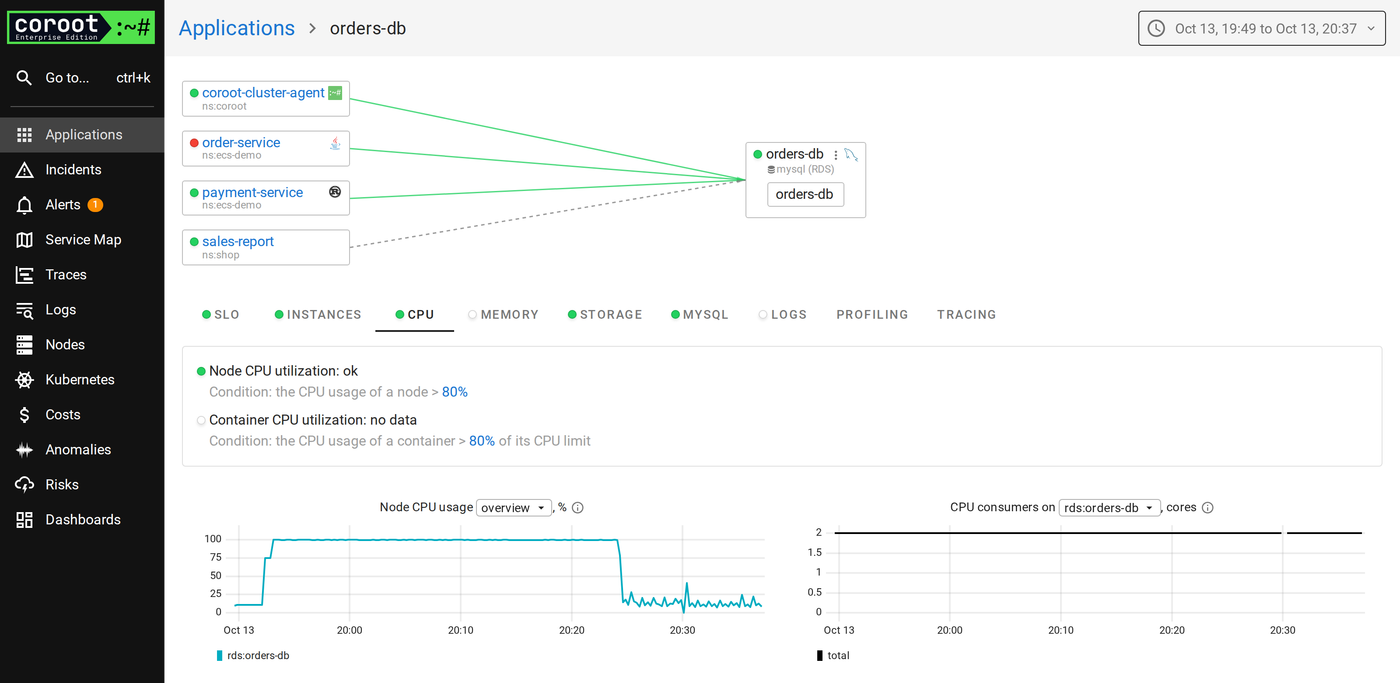
The symptom is on ECS, measured by eBPF. The cause is on EKS. The link is RDS: CPU at 100% from Enhanced Monitoring, and performance_schema naming the three report queries that ate the time.
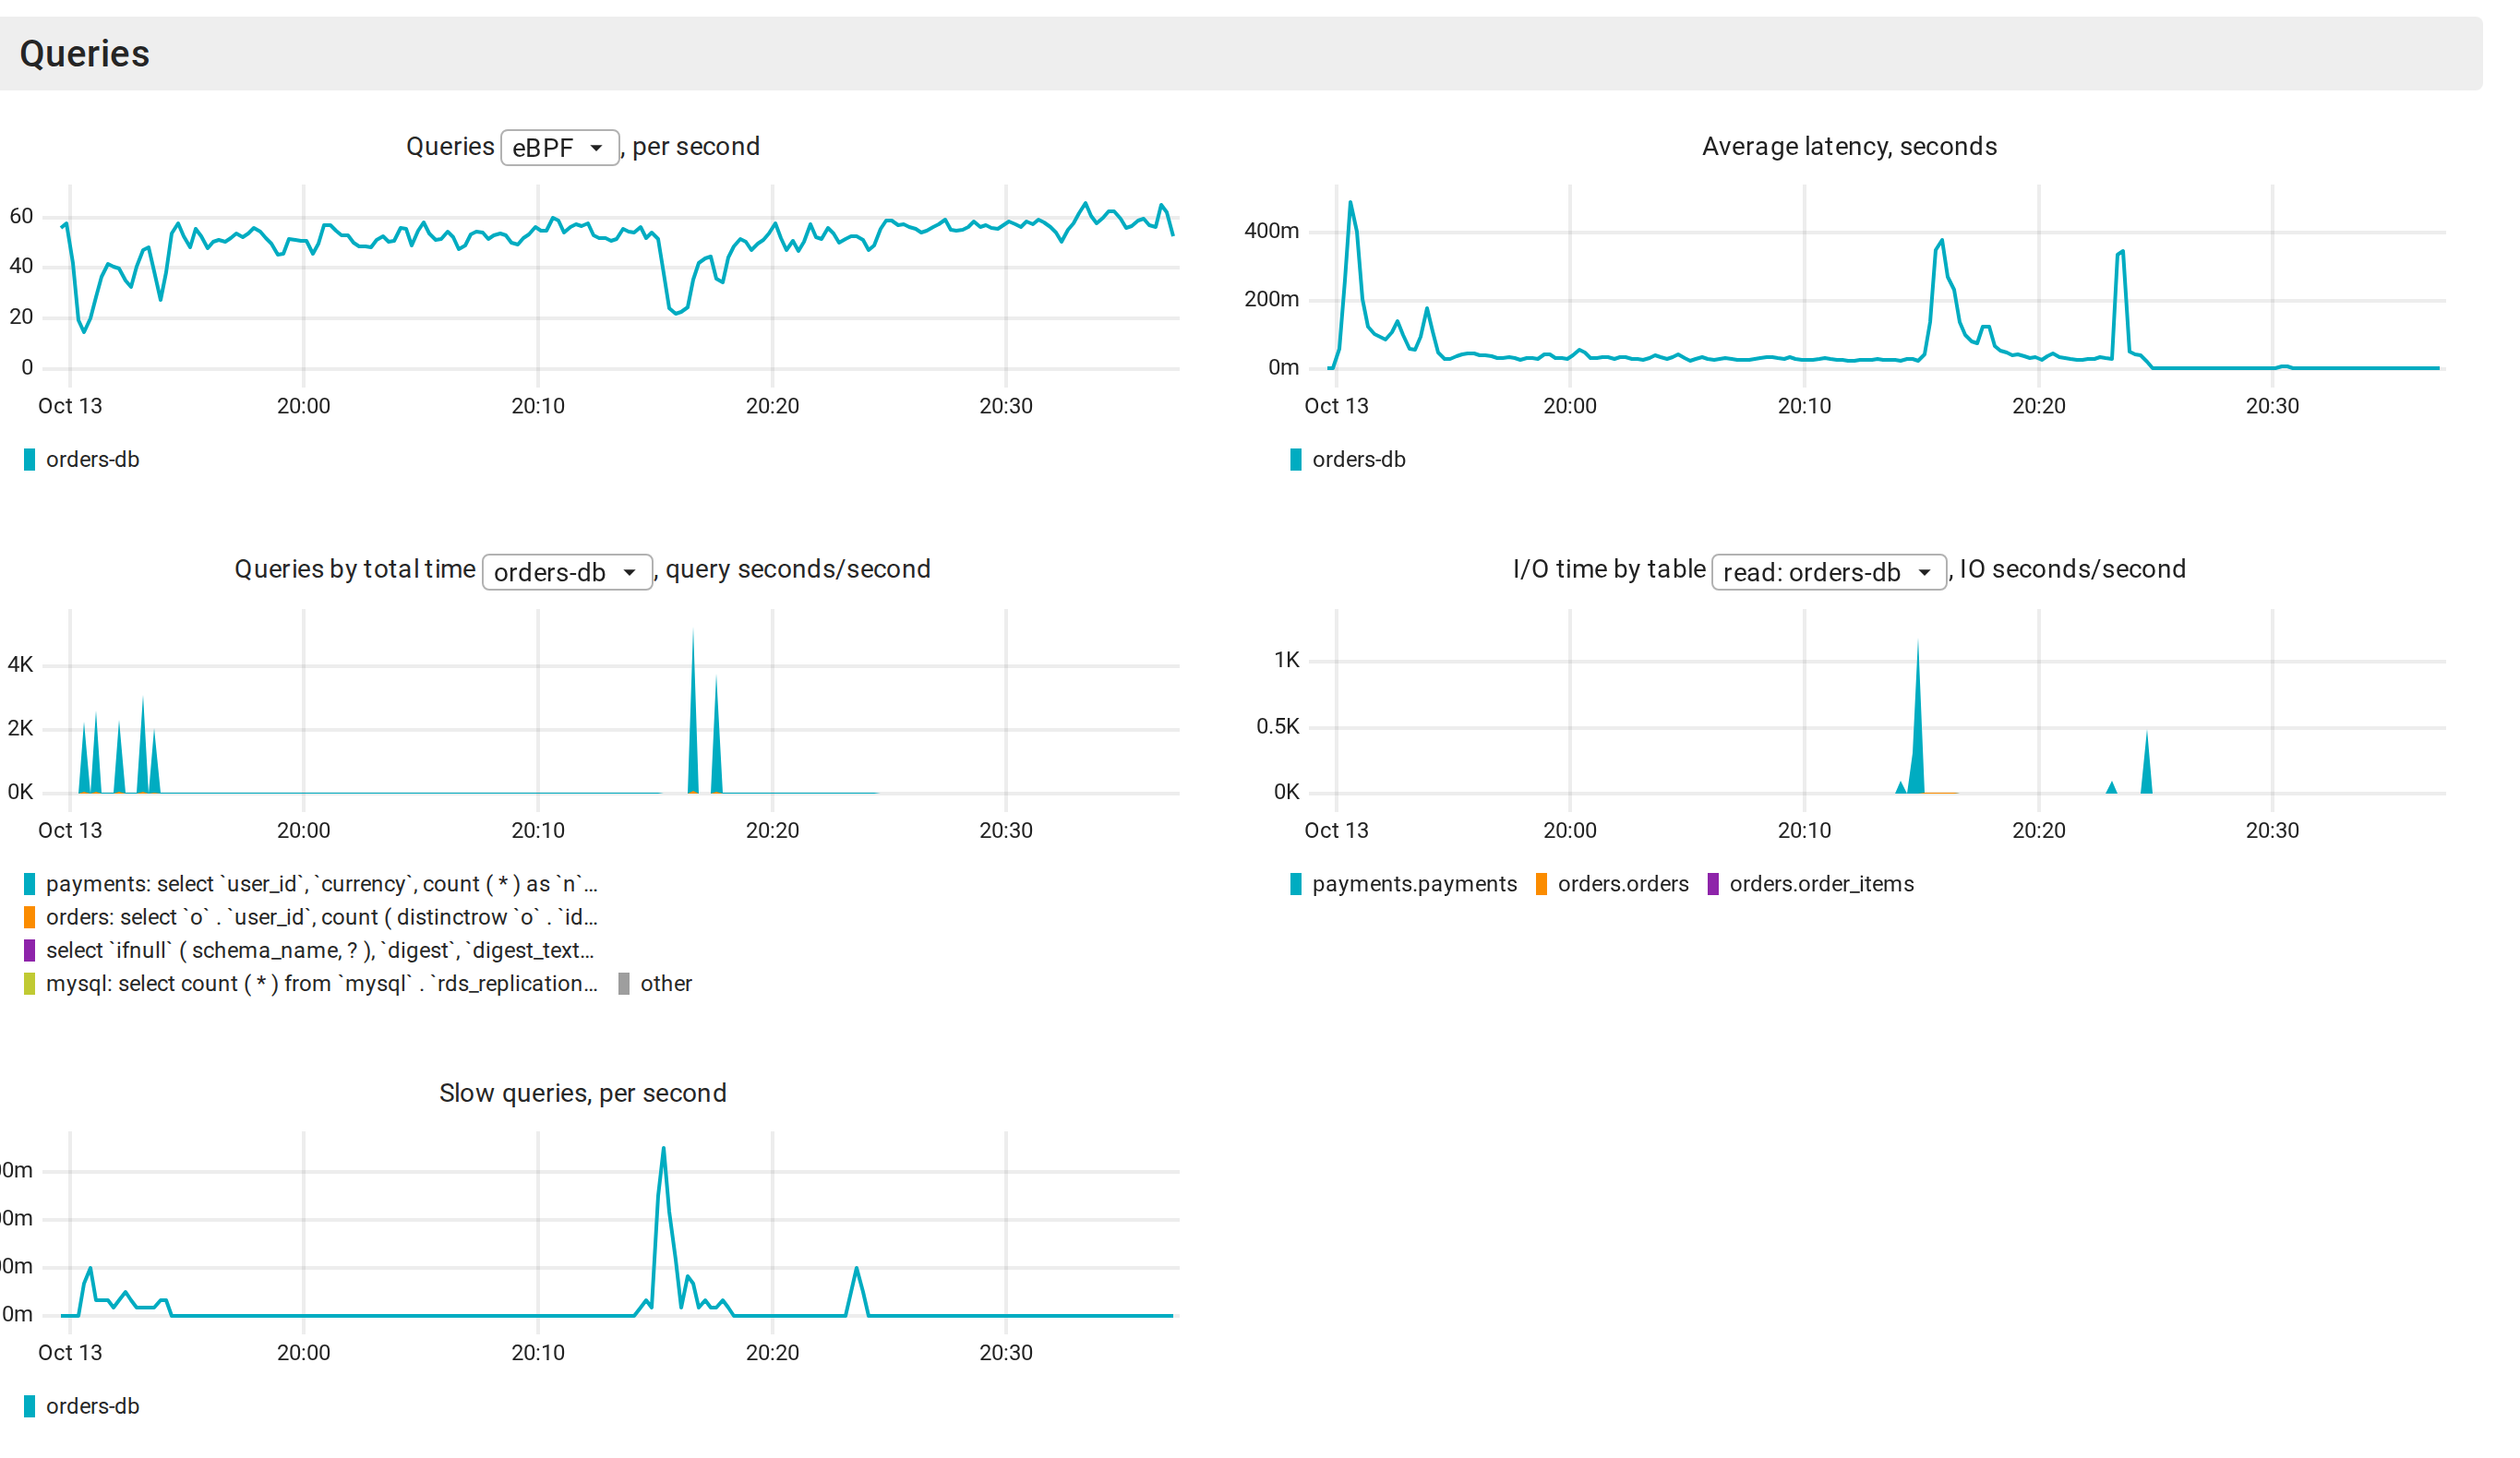
One RDS note: performance_schema is off by default on RDS MySQL unless Performance Insights is on. It is a static parameter, so you need a custom parameter group and a reboot. Coroot now says so on the MySQL tab instead of showing an empty chart.
Why none of this works on Fargate
On Fargate there is no node. Each task gets its own microVM and its own kernel, and AWS decides what you can do with it: no privileged, no host PID namespace, no host paths, no DAEMON services. The only capability you may add is SYS_PTRACE.
The agent needs all of that. It loads eBPF programs into the kernel, reads /proc and the cgroup tree of every process on the host, and watches all tasks on a node to build the map. On Fargate there is no shared kernel and no node to watch.
A sidecar would not help either. Even with the privileges, it would only see its own task, which is per-service instrumentation again. For that, use the OpenTelemetry SDK and send traces and logs to Coroot. More work per service, but the map still comes together.
On EC2 container instances it is three commands and no code changes. Use the ECS-optimized Amazon Linux 2023 AMI (kernel 6.1). The Amazon Linux 2 AMIs reached end of life in June 2026, and if you still have nodes on them, note that the stock 4.14 kernel is too old for the agent's eBPF programs.
Wrapping up
ECS on EC2 support is in Coroot 1.27.3 and coroot-node-agent 1.36.3. If you already run the agent on your ECS nodes, upgrading it is all it takes: the containers get regrouped into services the next time Coroot refreshes. If you don't, the task definition above is in the docs and on the agent installation page in Coroot.
The part I like most about this setup is how little of it is ECS-specific. The agent runs as a daemon service instead of a DaemonSet, reads a few Docker labels and one metadata endpoint, and from there every feature that works on Kubernetes works on ECS: the map, the SLOs, the JVM metrics, the profiler, the eBPF traces, and the RDS integration on the other end of the connection. Different scheduler, same kernel, same data.
If you run ECS and something doesn't line up on your map, open an issue or find us on Slack. And if you like Coroot, give us a ⭐ on GitHub.