Blog
Insights on observability, monitoring, and engineering best practices from the Coroot team.
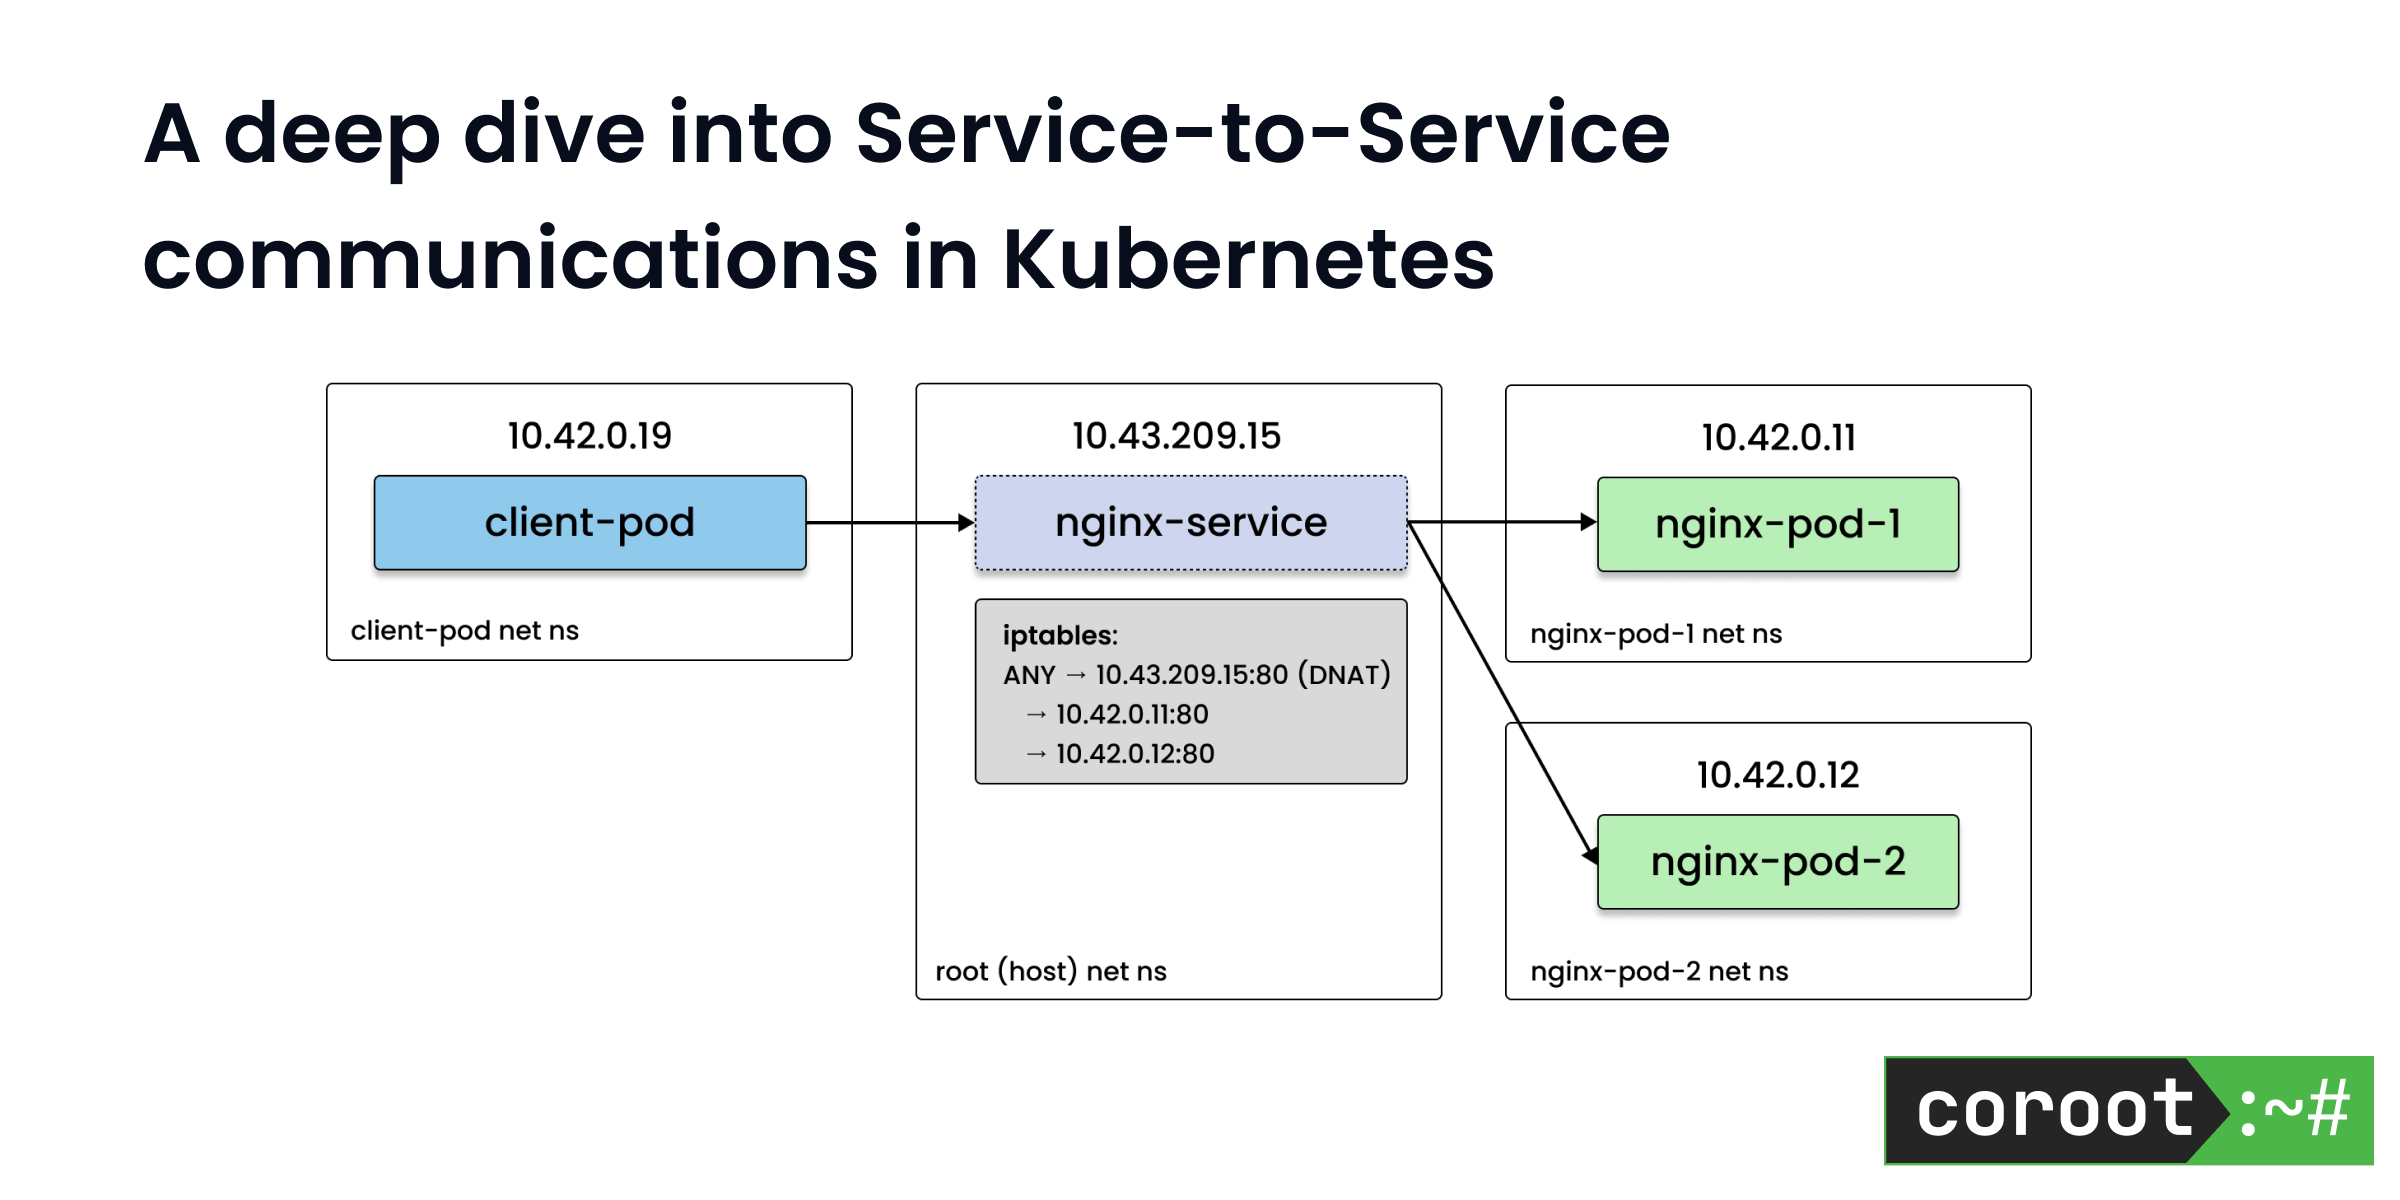
A deep dive into Service-to-Service communications in Kubernetes
A deep dive into how internal load balancing and traffic routing works in Kubernetes service-to-service communication.
 Nikolay Sivko
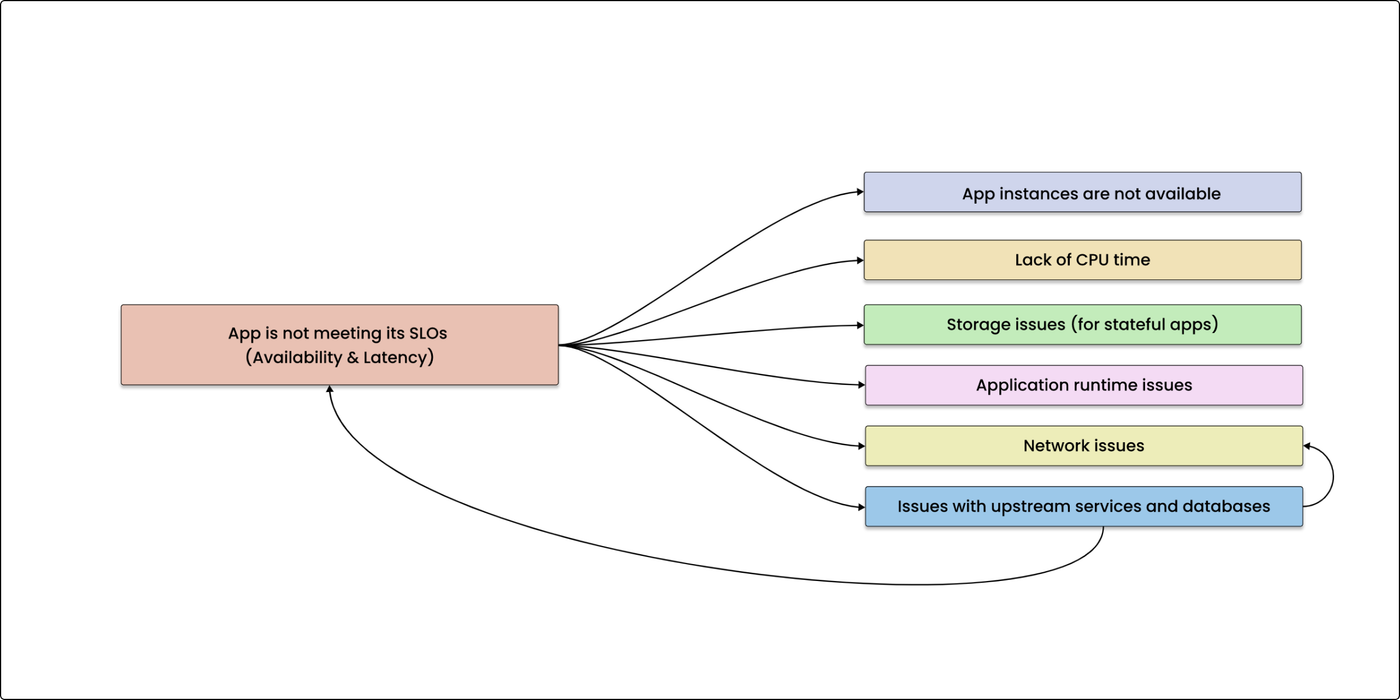
The pillars of observability are just data, let's turn them into actionable insights
The traditional observability pillars are just raw data—learn how Coroot turns metrics, logs, and traces into actionable insights that help you resolve problems.
Nikolay Sivko
Using eBPF and predefined inspections to minimize 'observability tax'
Learn how Coroot uses eBPF and predefined inspections to achieve fast, code-free monitoring with minimal observability overhead.
Nikolay Sivko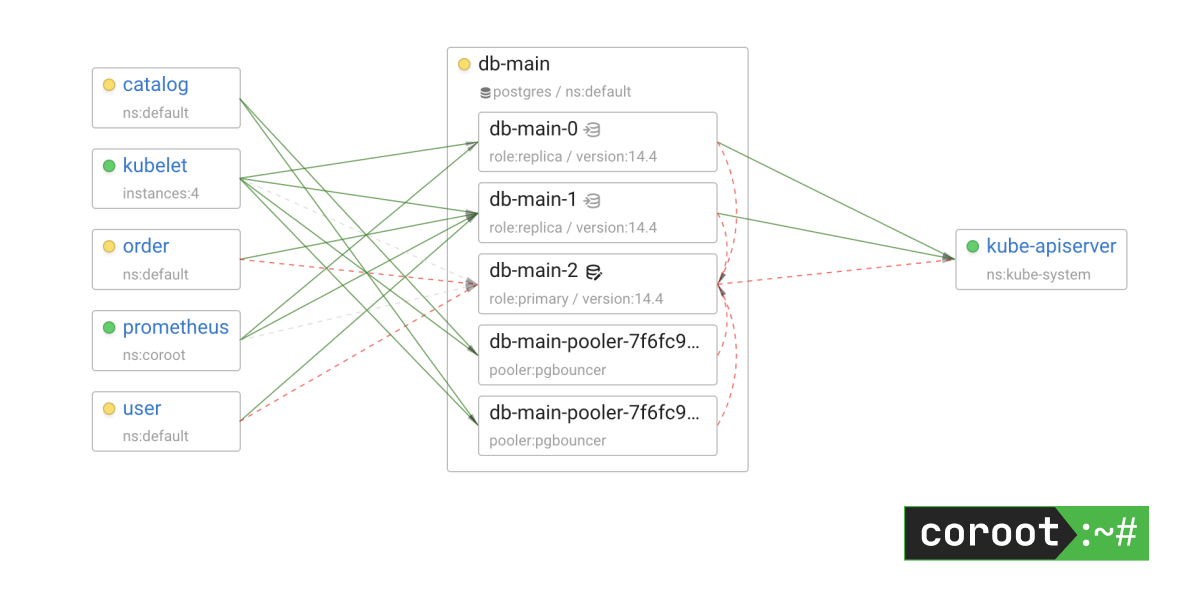
Advanced Postgres monitoring with Coroot (Apache 2.0)
Coroot Community Edition introduces advanced Postgres monitoring—track query performance, connections, and replication lag with zero extra setup.
Nikolay Sivko
App-centric inspections: turning the conventional metric analysis inside out
Coroot CE v0.5 introduces application-centric inspections that let you troubleshoot distributed systems faster by viewing health and root causes per application.
Nikolay Sivko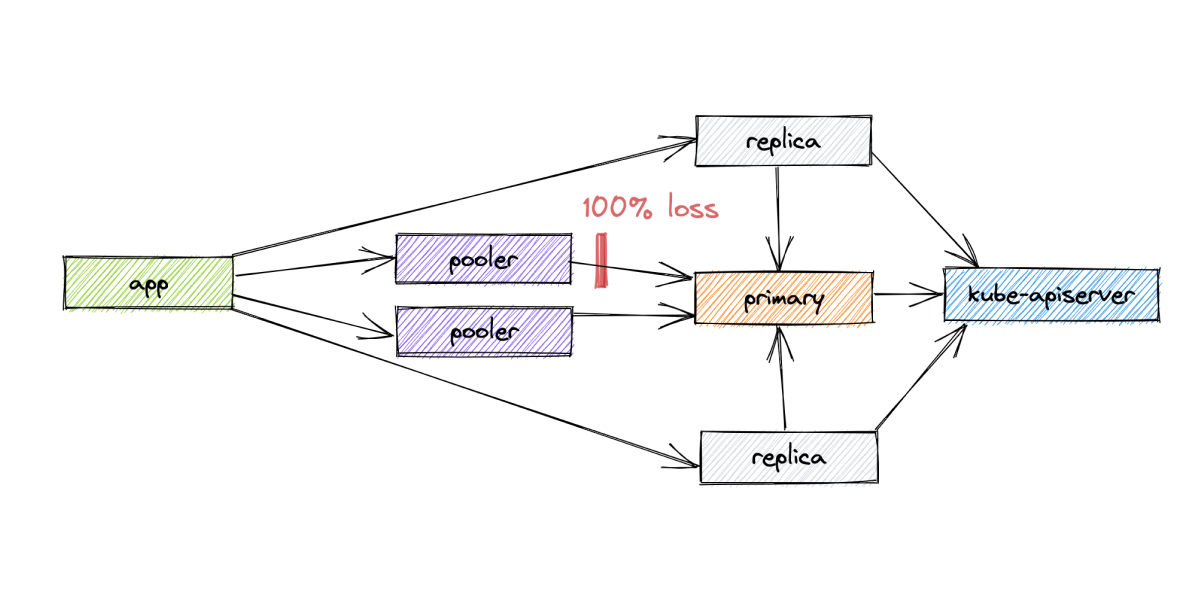
Chaos testing of a Postgres cluster managed by the Zalando Postgres Operator
Test how well a Postgres cluster managed by the Zalando Operator tolerates failures on Kubernetes, with Coroot observing and diagnosing each scenario.
Nikolay Sivko
Pg-agent – a Postgres exporter for Prometheus focusing on query performance statistics
Pg-agent is a Postgres exporter for Prometheus focused on query performance statistics, built to fill gaps left by existing exporters.
Nikolay Sivko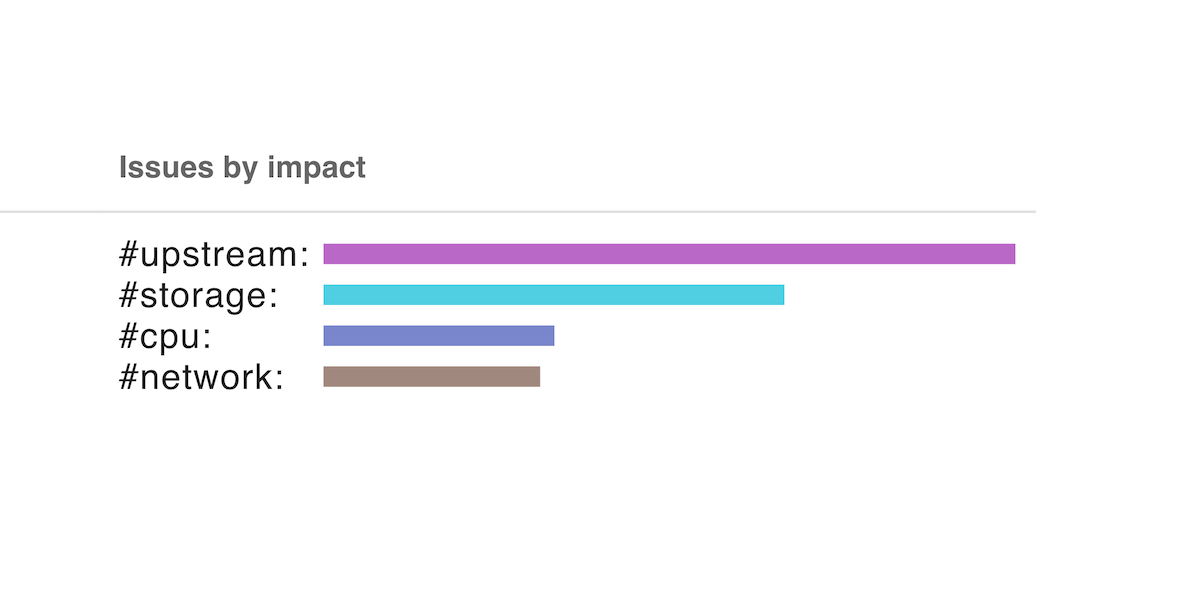
Just define your SLOs: no other configuration is needed to automate incident investigation
Define your SLOs and Coroot handles the rest—automating incident investigation with no additional configuration required.
Nikolay Sivko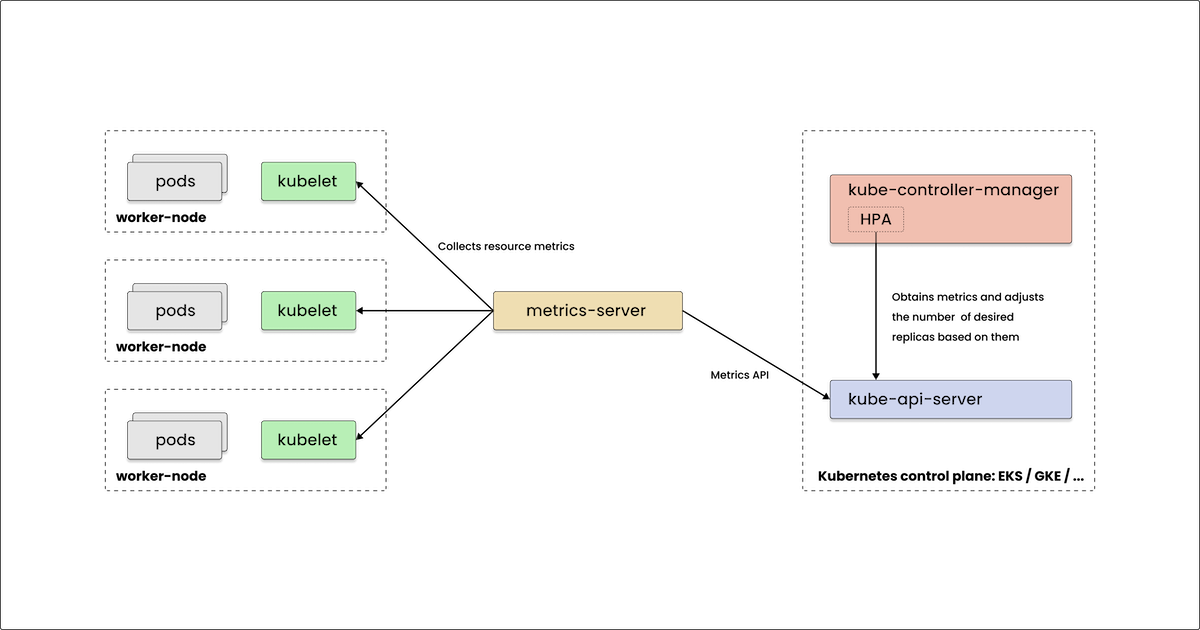
How quickly can the Kubernetes HPA scale your app?
Real-world measurements of Kubernetes HPA scaling delays and how tuning metrics-server parameters can dramatically improve response times.
Nikolay Sivko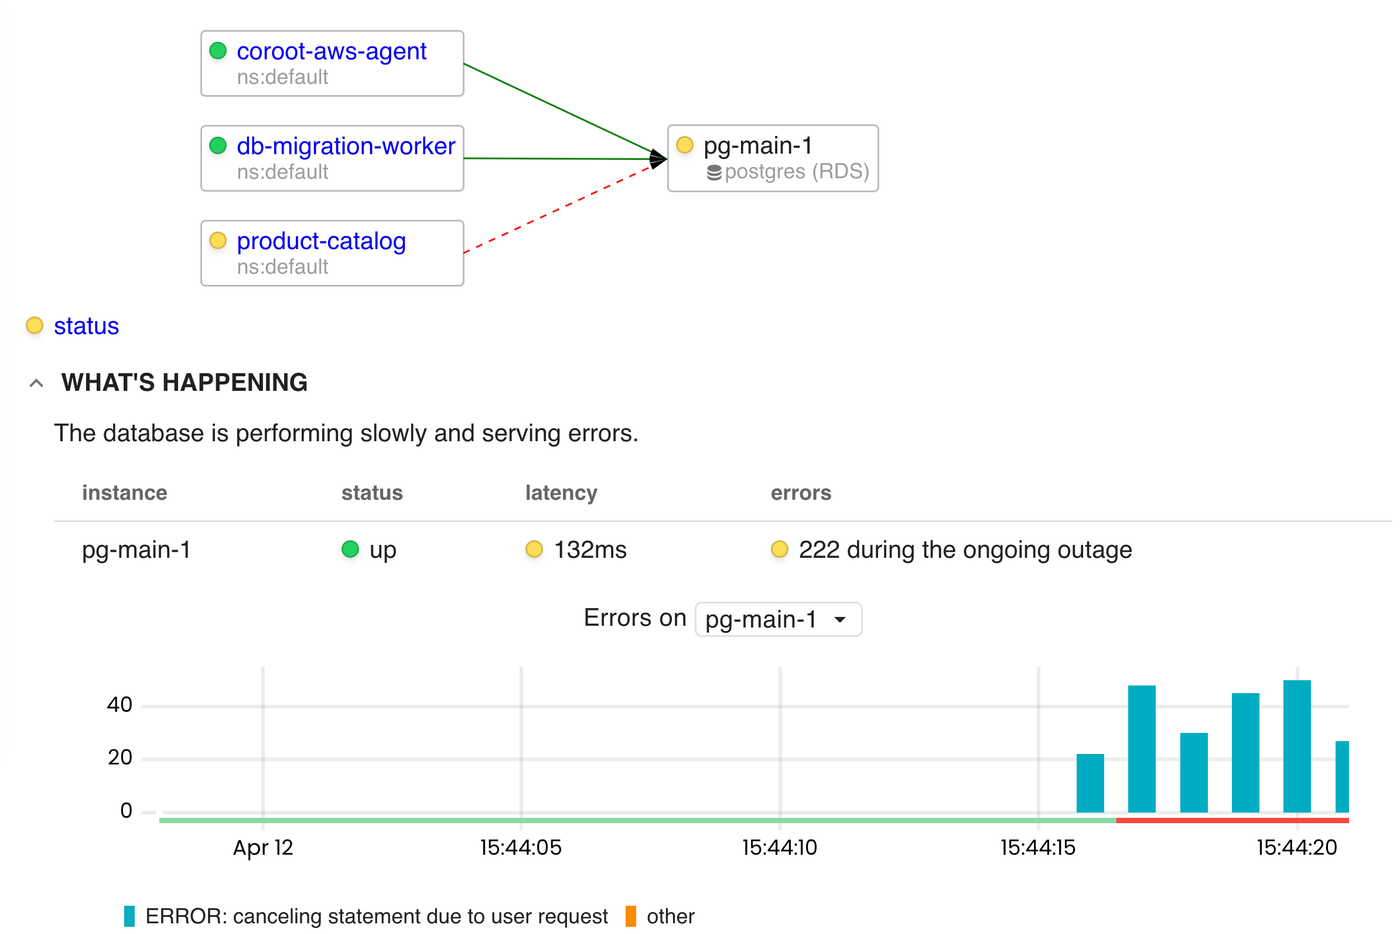
Missing metrics required to gain visibility into Postgres performance
Standard Postgres monitoring often misses the metrics that matter most—like query success rates and latency—and this post explains how to capture them.
Nikolay Sivko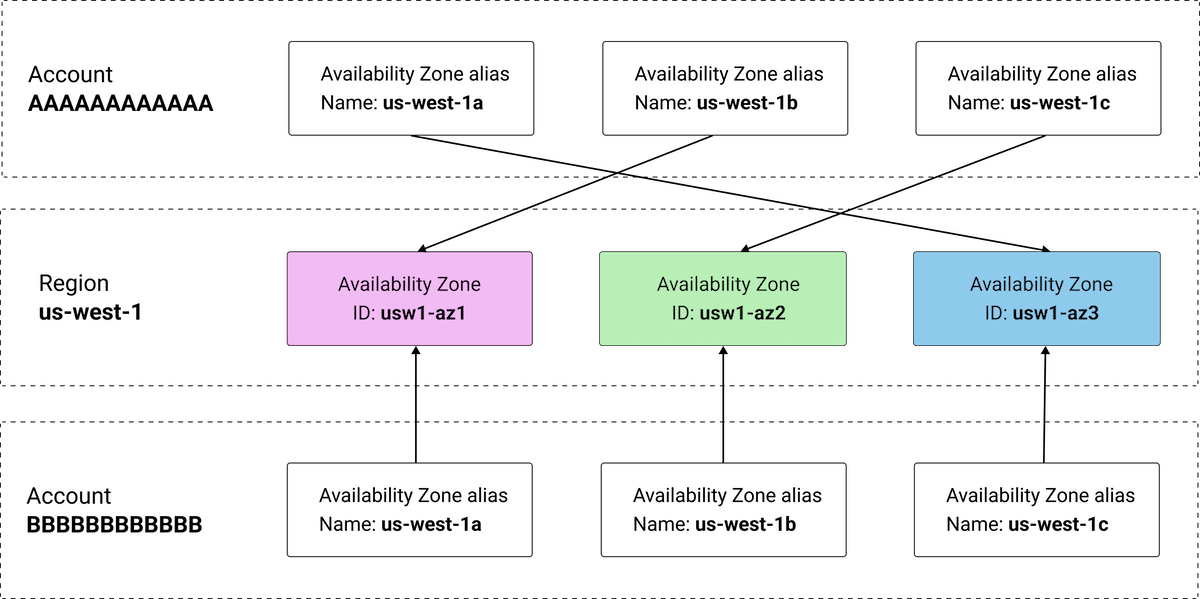
Gathering cloud instance metadata in AWS, GCP and Azure
Learn how Coroot automatically collects cloud instance metadata from AWS, GCP, and Azure to enrich your monitoring data with provider, region, and cost context.
Nikolay Sivko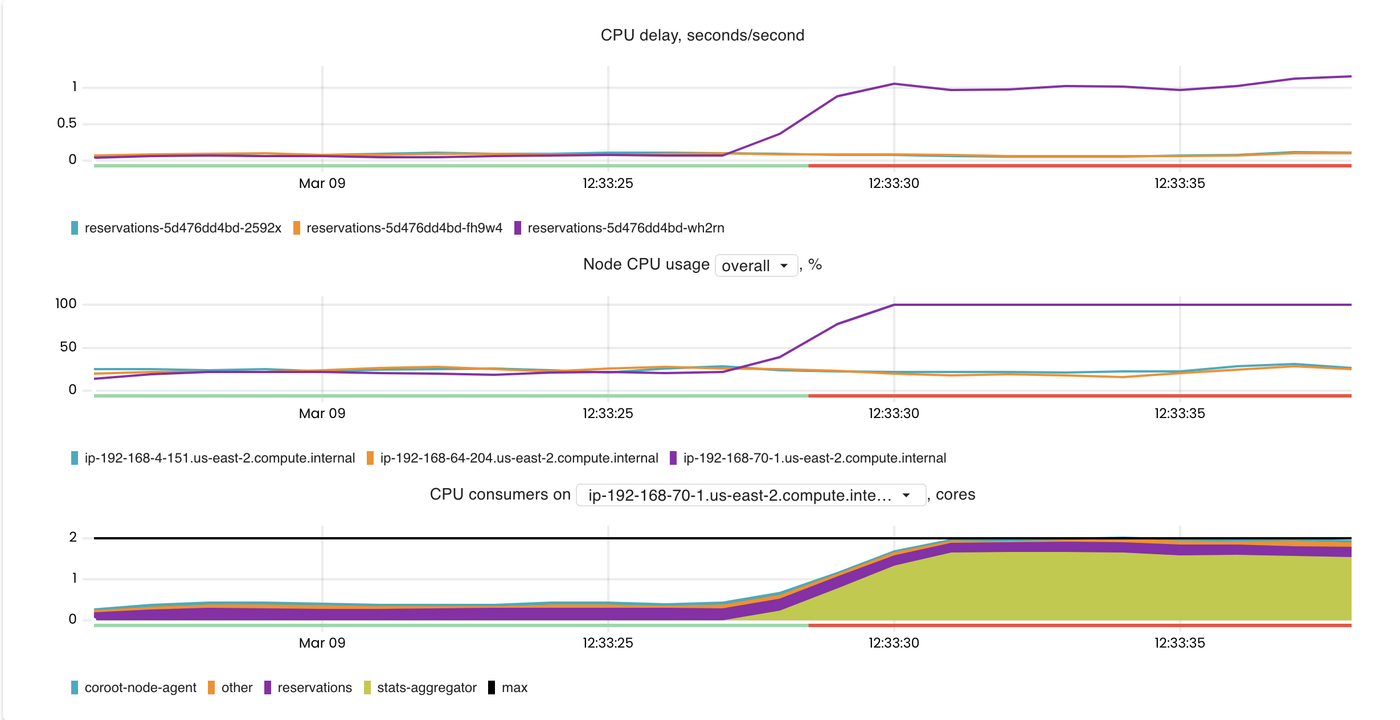
Delay accounting: an underrated feature of the Linux kernel
Learn how Coroot uses Linux delay accounting—an underused kernel feature—to detect CPU scheduling delays and latency issues automatically.
Nikolay SivkoTry Coroot Free
Get full-stack observability in minutes with zero code changes. eBPF-powered monitoring with AI-guided root cause analysis.